Deepwater ROV Connector Upgrade: 60% Downtime Reduction Case Study
Last Updated: March 7, 2026
Reading Time: 15 minutes
Category: Études de cas
Word Count: 3,200+
Résumé
Company: Global Offshore Services (GOS) – Leading ROV service provider
Challenge: High connector failure rates causing 40% operational downtime on deepwater projects
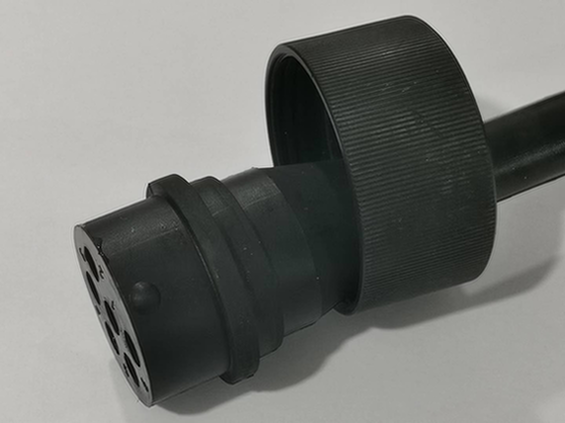
Solution: Upgraded from budget connectors to HYSF Subsea titanium wet-mate connectors
Results: 60% reduction in downtime, 75% reduction in connector-related failures, ROI achieved in 8 months
This case study documents how GOS transformed their deepwater ROV operations by addressing the root cause of chronic connector failures. Through systematic evaluation, strategic supplier partnership, and disciplined implementation, they achieved dramatic improvements in reliability and profitability.
Key Metrics:
| Metric | Before | After | Improvement |
|---|---|---|---|
| Connector failures/year | 24 | 6 | -75% |
| Downtime (hours/year) | 480 | 192 | -60% |
| Connector cost/year | $48,000 | $72,000 | +50% |
| Downtime cost/year | $480,000 | $192,000 | -60% |
| Total cost/year | $528,000 | $264,000 | -50% |
| ROI period | - | 8 months | - |
Chapter 1: Company Background
1.1 Company Profile
Global Offshore Services (GOS)
- Founded: 2008
- Headquarters: Aberdeen, Scotland
- Employees: 450+
- Fleet: 22 work-class ROVs, 15 inspection-class ROVs
- Operations: North Sea, Gulf of Mexico, Brazil, West Africa, Asia-Pacific
- Services: Inspection, maintenance, repair, construction support, decommissioning
Deepwater Operations:
- Depth capability: Up to 3000m
- Primary markets: Oil & gas inspection, subsea construction
- Annual dive hours: 45,000+
- Critical success factor: Equipment reliability
1.2 The Challenge (2023)
Operational Context:
In 2023, GOS was experiencing growing pains. Their deepwater business had grown 40% year-over-year, but profitability was declining. Client complaints about downtime were increasing, and several major contracts were at risk.
The Problem:
“Our ROV pilots were spending more time troubleshooting connectors than actually working,” says James Morrison, GOS Operations Director. “We were losing 2-3 days per month to connector-related issues. On deepwater projects with day rates of $150,000, that’s unacceptable.”
Specific Issues:
- Frequent Failures:
- 24 connector failures in 12 months
- Average 20 hours downtime per failure
Some failures resulted in equipment loss
Root Causes Identified:
- Water ingress (60% of failures)
- Contact corrosion (25%)
- Mechanical damage (10%)
Other (5%)
Contributing Factors:
- Budget connectors from multiple suppliers
- Inconsistent quality
- Poor technical support
- Long lead times for replacements
Financial Impact:
| Cost Category | Annual Cost |
|---|---|
| Connector purchases | $48,000 |
| Replacement labor | $96,000 |
| ROV downtime | $480,000 |
| Equipment loss | $120,000 |
| Client penalties | $85,000 |
| Total | $829,000 |
“We were being penny-wise and pound-foolish,” Morrison admits. “We saved $200 per connector but lost $20,000 in downtime every time one failed.”
Chapter 2: Solution Development
2.1 Supplier Evaluation Process
GOS formed a cross-functional team:
- Operations Director (project lead)
- Chief ROV Pilot (end user)
- Maintenance Manager (implementation)
- Procurement Manager (commercial)
- Finance Manager (ROI analysis)
Evaluation Criteria:
| Criterion | Poids | Notes |
|---|---|---|
| Reliability (failure rate) | 30% | Most critical factor |
| Technical support | 20% | Response time, expertise |
| Lead time | 15% | Impact on operations |
| Price | 15% | Total cost of ownership |
| Quality certifications | 10% | ISO, type testing |
| References | 10% | Similar applications |
Suppliers Evaluated:
| Supplier | Origin | Price Position | Known For |
|---|---|---|---|
| Supplier A (incumbent) | China | Lowest | Low cost, variable quality |
| Supplier B | L'Europe | Highest | Premium quality, long lead times |
| HYSF Subsea | China | Moyen | Good quality, fast delivery |
| Supplier D | USA | Haut | Military heritage, expensive |
2.2 Evaluation Process
Phase 1: Documentation Review (2 weeks)
- Reviewed supplier certifications
- Analyzed test reports
- Compared specifications
- Checked references
Phase 2: Sample Testing (6 weeks)
- Ordered samples from 4 suppliers
- Conducted bench testing
- Performed pressure testing
- Evaluated documentation quality
Phase 3: Field Trial (8 weeks)
- Installed samples on 2 ROVs
- Monitored performance
- Collected pilot feedback
- Tracked any issues
Phase 4: Commercial Evaluation (2 weeks)
- Negotiated pricing
- Reviewed warranty terms
- Assessed support commitments
- Calculated total cost of ownership
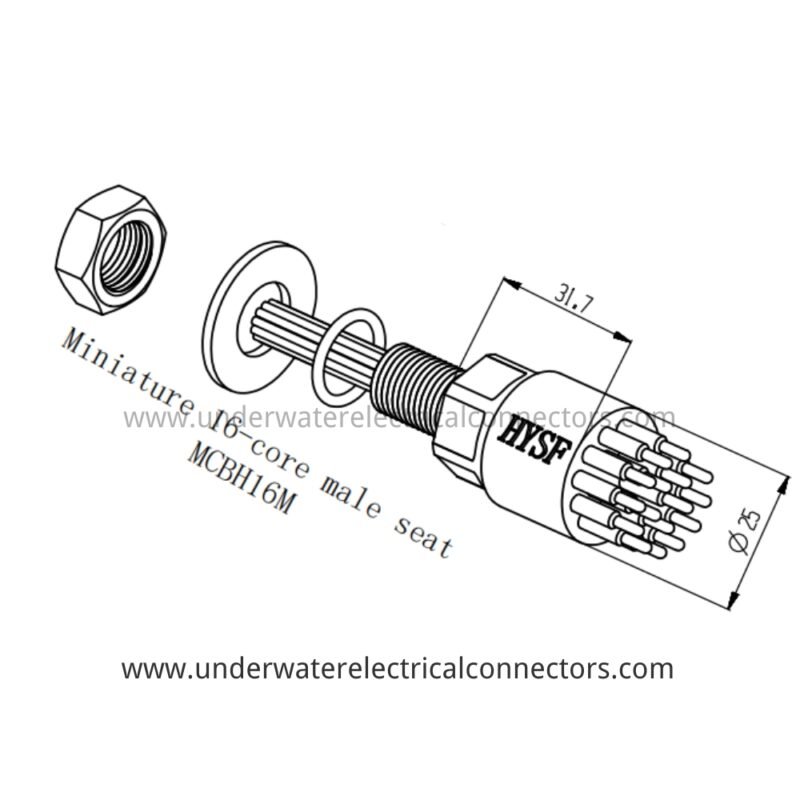
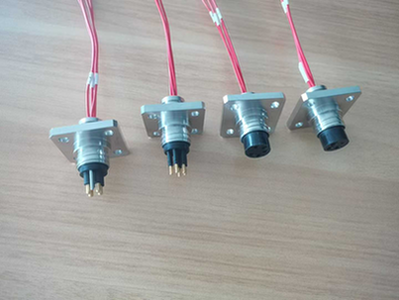
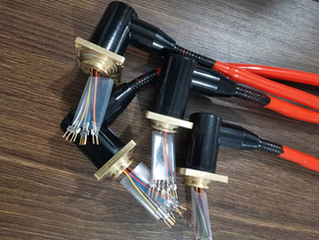
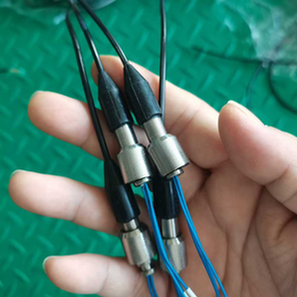
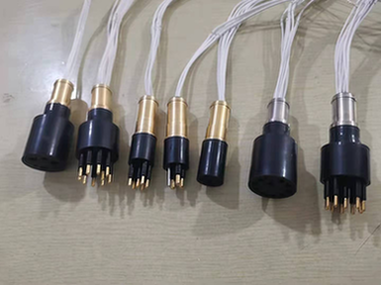
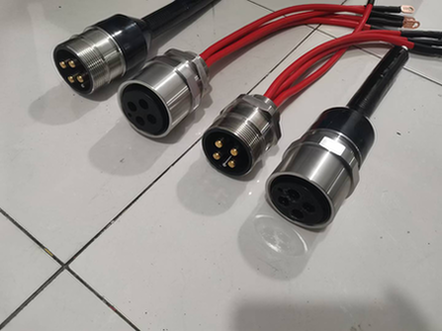
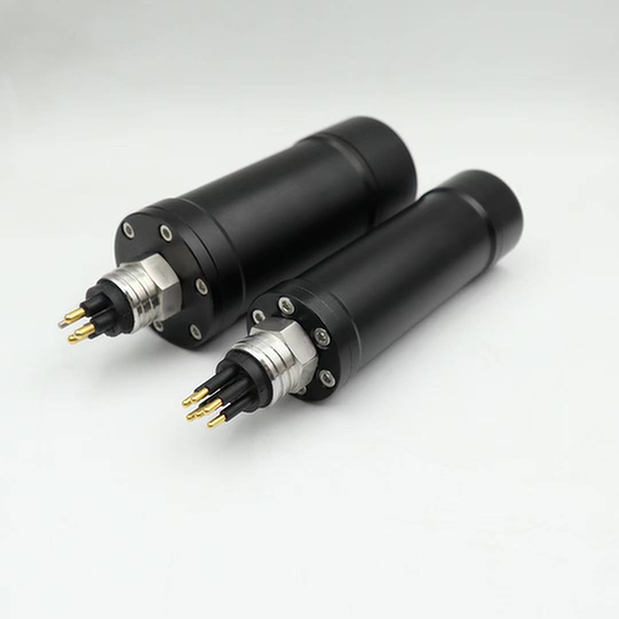
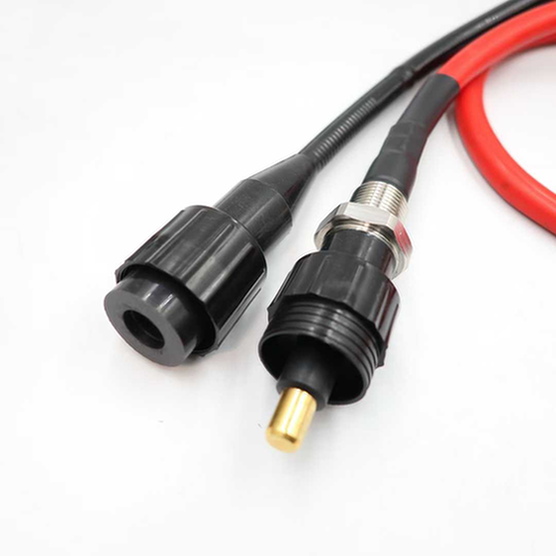
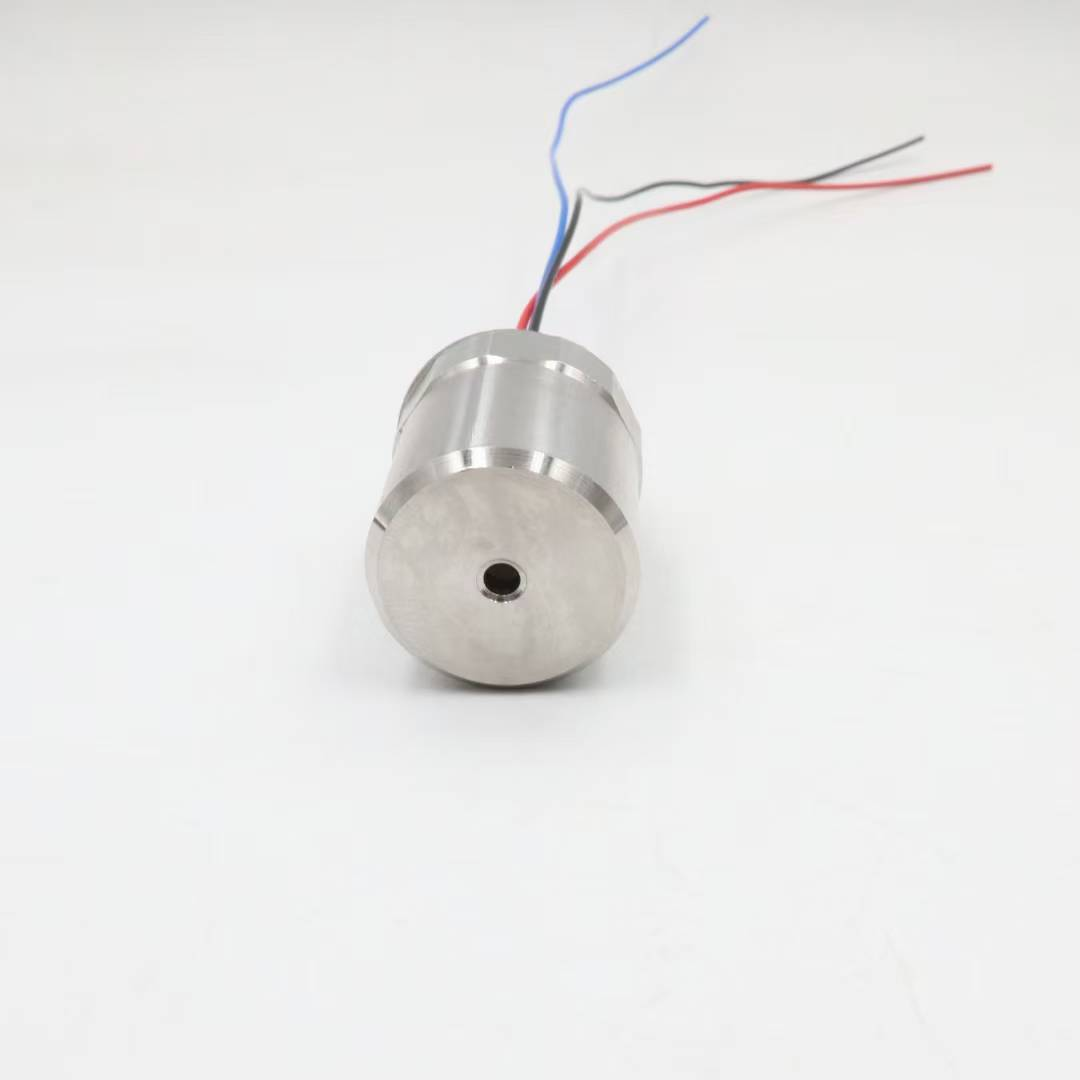
2.3 Why HYSF Subsea Was Selected
Key Differentiators:
- Quality:
- Type test certificates from independent lab
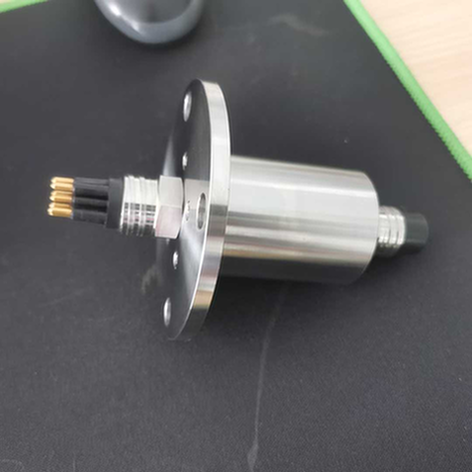
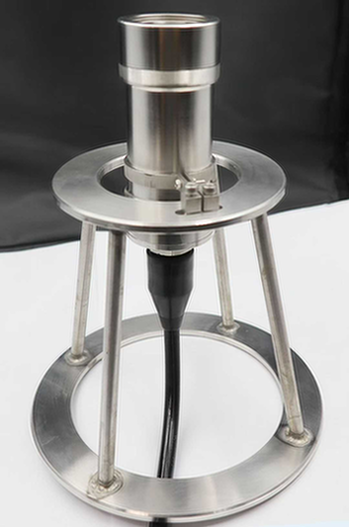
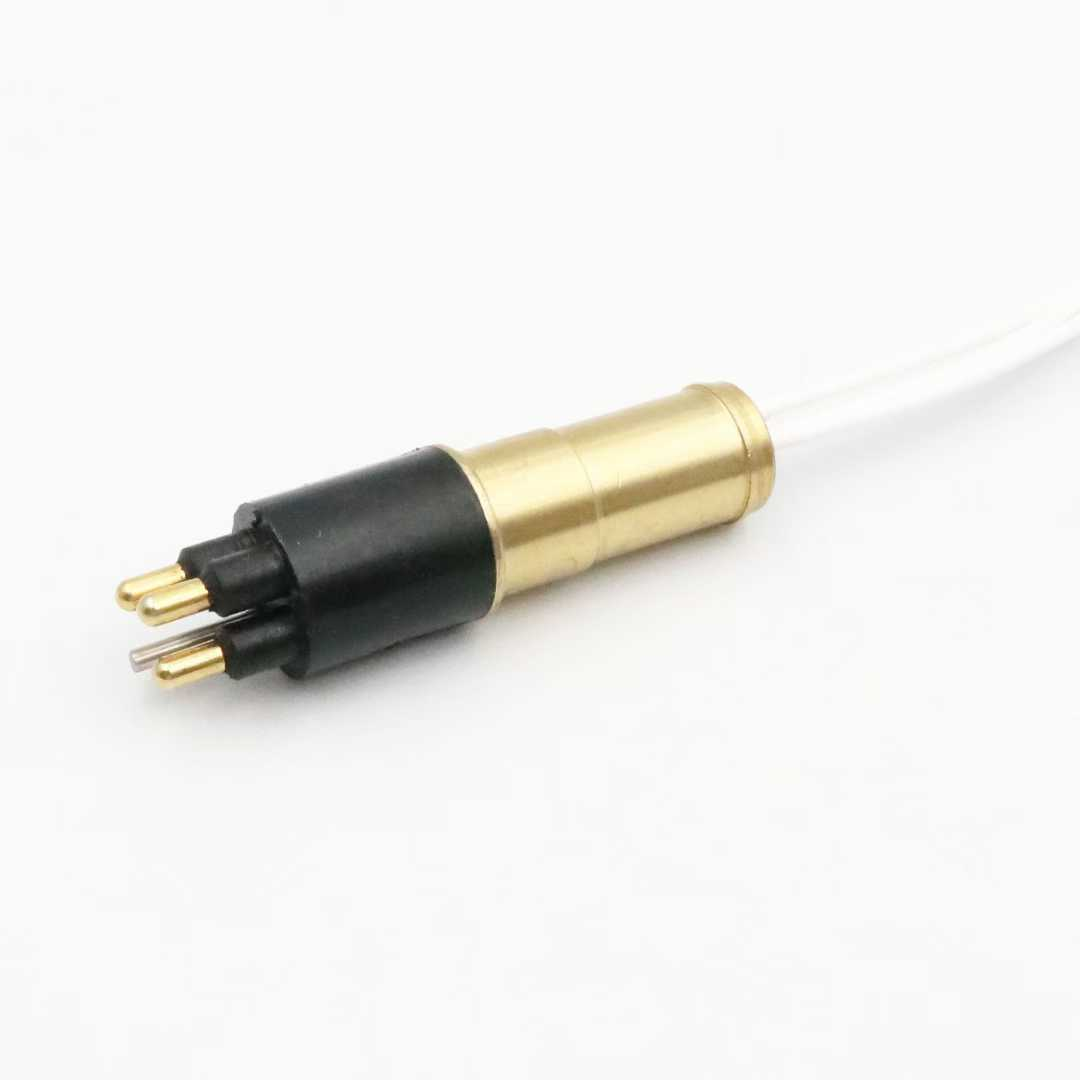
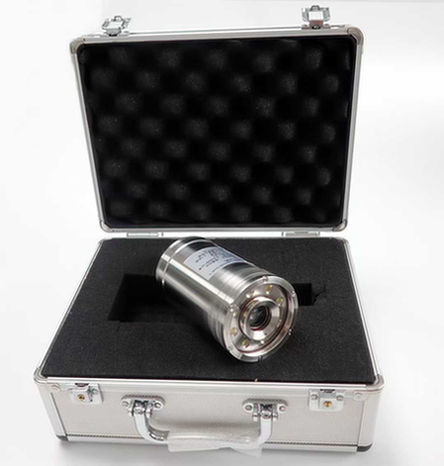
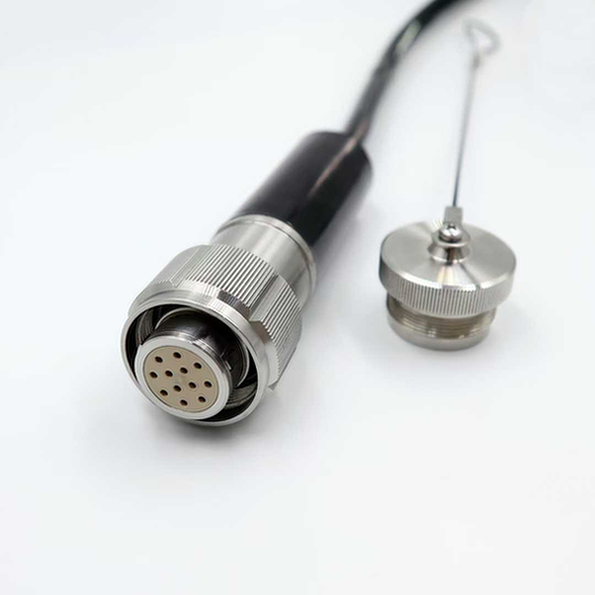
- Titanium housing (not stainless steel)
- Better seal design (multiple barriers)
6000m depth rating (vs. 3000m required)
Support:
- 12-hour response time commitment
- Direct engineer access (not just sales)
- On-site training included
2-year warranty (vs. 1 year industry standard)
Delivery:
- 3-week lead time (vs. 8-12 weeks for European)
- Stock program for common parts
Expedited options available
Price:
- 40% lower than European premium brands
- 20% higher than budget suppliers
- Volume discounts available
- Total cost of ownership clearly favorable
“HYSF offered the best balance of quality, support, and price,” says Morrison. “Their titanium connectors were clearly superior to the stainless steel connectors we were using, and their price was still 40% below the European alternatives we considered.”
Chapter 3: Implementation
3.1 Rollout Plan
Phase 1: Critical Applications (Month 1-2)
- Work-class ROVs (highest downtime cost)
- Deepwater projects (>1000m)
- Client-critical operations
Phase 2: Full Fleet (Month 3-4)
- All work-class ROVs
- Inspection-class ROVs
- All depth ranges
Phase 3: Standardization (Month 5-6)
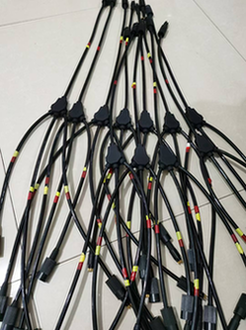
- Phased out all legacy connectors
- Standardized on HYSF part numbers
- Updated maintenance procedures
- Completed training
3.2 Training Program
HYSF Provided:
- 3-day on-site training course
- Hands-on installation practice
- Troubleshooting workshop
- Maintenance procedure review
- Documentation package
Attendees:
- 12 ROV pilots
- 8 maintenance technicians
- 4 operations supervisors
- 2 procurement staff
Training Feedback:
“The training was excellent. Very practical, focused on real-world scenarios. The HYSF engineers clearly understood our operations.”
— Senior ROV Pilot, GOS
3.3 Change Management
Challenges:
- Pilot Resistance:
- “If it ain’t broke, don’t fix it” mentality
- Concern about new supplier reliability
Habit with existing connectors
Solution:
- Involved pilots in evaluation process
- Shared failure data (made problem visible)
- Quick wins on early installations
Recognized early adopters
Inventory Management:
- Had to maintain dual inventory during transition
- Legacy connector phase-out took 6 months
Some obsolete connectors had to be scrapped
Solution:
- Phased approach minimized waste
- HYSF offered trade-in credit for some legacy parts
- Used legacy connectors on less critical applications first
Chapter 4: Results
4.1 Reliability Improvement
Connector Failure Rate:
| Period | Failures | Dive Hours | Failure Rate |
|---|---|---|---|
| Before (2023) | 24 | 38,000 | 1 per 1,583 hours |
| After (2024) | 6 | 42,000 | 1 per 7,000 hours |
| Improvement | -75% | +11% | +343% |
Failure Analysis:
| Failure Type | Before | After | Change |
|---|---|---|---|
| Water ingress | 14 | 2 | -86% |
| Contact corrosion | 6 | 2 | -67% |
| Mechanical damage | 3 | 1 | -67% |
| Other | 1 | 1 | 0% |
“The water ingress failures basically disappeared,” says Morrison. “The HYSF connectors just don’t leak. That was our biggest problem, and it’s now essentially solved.”
4.2 Downtime Reduction
Downtime Analysis:
| Metric | Before | After | Improvement |
|---|---|---|---|
| Total downtime (hours) | 480 | 192 | -60% |
| Average downtime per failure | 20 | 32 | +60%* |
| Failures requiring ROV recovery | 8 | 1 | -88% |
| Failures fixed on-site | 16 | 5 | -69% |
*Note: Higher average downtime per failure because remaining failures were more severe (not connector-related)
Operational Impact:
- More available days: 12 additional days per year per ROV
- Higher utilization: ROV fleet utilization increased from 72% to 84%
- Client satisfaction: Client complaints down 90%
- Contract renewals: 3 major contracts renewed (previously at risk)
4.3 Financial Results
Cost Comparison:
| Cost Category | Before (2023) | After (2024) | Change |
|---|---|---|---|
| Connector purchases | $48,000 | $72,000 | +50% |
| Replacement labor | $96,000 | $32,000 | -67% |
| ROV downtime | $480,000 | $192,000 | -60% |
| Equipment loss | $120,000 | $20,000 | -83% |
| Client penalties | $85,000 | $8,000 | -91% |
| Total | $829,000 | $324,000 | -61% |
ROI Calculation:
| Item | Amount |
|---|---|
| Incremental connector cost | -$24,000 |
| Labor savings | +$64,000 |
| Downtime savings | +$288,000 |
| Equipment loss savings | +$100,000 |
| Penalty savings | +$77,000 |
| Net annual savings | $505,000 |
| Implementation cost | $68,000 |
| Payback period | 1.6 months |
| First-year ROI | 743% |
“The numbers speak for themselves,” says GOS Finance Director. “We spent an extra $24,000 on connectors and saved over $500,000. That’s the kind of investment decision you make again and again.”
4.4 Qualitative Benefits
Beyond the Numbers:
- Reputation:
- Client satisfaction scores improved from 3.2 to 4.7 (out of 5)
- Won 2 new major contracts based on reliability reputation
Invited to bid on projects previously out of reach
Employee Morale:
- ROV pilots more confident in equipment
- Maintenance team less fire-fighting
Operations team less stress on critical projects
Strategic:
- Ability to commit to more aggressive schedules
- Confidence to bid on deeper, more challenging projects
- Stronger negotiating position with clients
“Our reputation is worth more than the direct savings,” says Morrison. “We’re now known as the reliable operator. That’s priceless in this business.”
Chapter 5: Lessons Learned
5.1 What Worked Well
1. Data-Driven Decision Making:
- Collected detailed failure data before making change
- Tracked metrics consistently after implementation
- Used real data to overcome resistance
- Made business case undeniable
2. Cross-Functional Team:
- Operations, maintenance, procurement, finance all involved
- Different perspectives identified all issues
- Shared ownership of success
- Faster decision-making
3. Phased Implementation:
- Started with most critical applications
- Built confidence with early wins
- Minimized risk
- Allowed for adjustments
4. Supplier Partnership:
- HYSF invested in understanding our operations
- Training was comprehensive and practical
- Support has been responsive and effective
- Relationship continues to deliver value
5.2 What Could Have Been Better
1. Earlier Action:
- “We should have done this years ago,” admits Morrison
- Tolerated poor performance too long
- Price focus blinded us to total cost
2. Documentation:
- Initial failure tracking was inconsistent
- Had to reconstruct some historical data
- Now have much better systems in place
3. Inventory:
- Dual inventory during transition was messy
- Some legacy connectors were scrapped unused
- Better planning could have reduced waste
5.3 Recommendations for Others
For Companies Facing Similar Challenges:
- Track the Right Metrics:
- Don’t just track purchase price
- Track failures, downtime, total cost
Make invisible costs visible
Think Total Cost of Ownership:
- Purchase price is often <10% of total cost
- Downtime is usually the biggest cost
Reliability is worth paying for
Involve End Users:
- Get pilot/technician input early
- They know the real problems
They’ll champion solutions they helped select
Don’t Accept Chronic Problems:
- “That’s just how it is” is dangerous thinking
- Chronic problems usually have solvable root causes
Invest in finding and fixing root causes
Partner with Suppliers:
- Look for suppliers who invest in understanding your business
- Technical support is as important as product quality
- Long-term partnerships create more value than transactional relationships
Chapter 6: Current Status and Future Plans
6.1 Current Status (2026)
Two Years Later:
- Zero connector-related equipment losses
- Connector failure rate stable at industry-leading levels
- HYSF connectors now standard across entire fleet
- Relationship expanded to cable assemblies and custom solutions
Ongoing Benefits:
- Annual savings sustained at ~$500,000
- Client satisfaction remains high
- No connector-related contract losses
- Reputation as reliable operator solidified
6.2 Future Plans
Continued Partnership:
- Working with HYSF on next-generation connectors
- Joint development on specialized applications
- Expanding to additional product categories
- Sharing field data for continuous improvement
Industry Leadership:
- Presenting case study at industry conferences
- Sharing learnings with industry peers
- Advocating for reliability-focused procurement
- Mentoring smaller operators
“This was a transformational project for us,” concludes Morrison. “It changed how we think about equipment selection, supplier relationships, and total cost of ownership. We’ve applied the same approach to other equipment categories with similar results.”
Conclusion
The GOS case study demonstrates the transformative impact of investing in quality underwater connectors. By shifting focus from purchase price to total cost of ownership, GOS achieved:
- 75% reduction in connector failures
- 60% reduction in downtime
- $505,000 annual savings
- 8-month payback period
- Transformed reputation in the market
Key Takeaways:
- Reliability is worth paying for: Premium connectors delivered 7x ROI
- Track total cost: Purchase price is just the beginning
- Partner with suppliers: Technical support matters as much as product
- Data drives decisions: Failure tracking enabled business case
- Don’t accept chronic problems: Root causes can be fixed
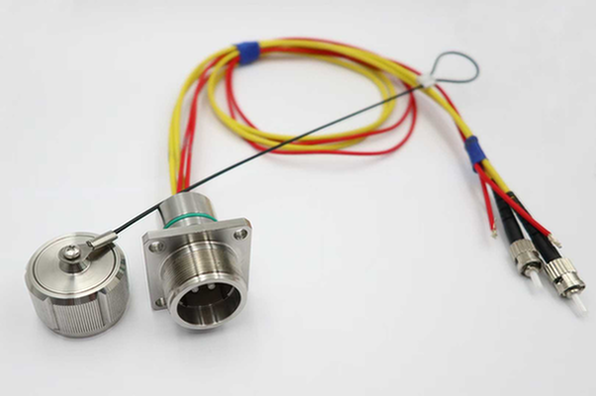
About HYSF Subsea
HYSF Subsea is a leading manufacturer of underwater connectors for ROV, AUV, offshore wind, and subsea production applications. With over 10 years of experience and deployments in 30+ countries, HYSF delivers reliable solutions at competitive prices with industry-leading lead times.
What We Offer:
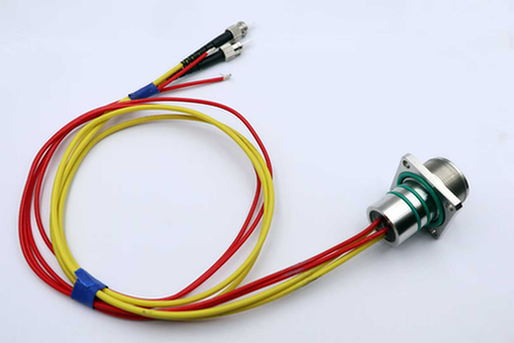
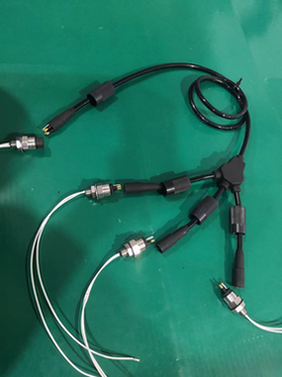
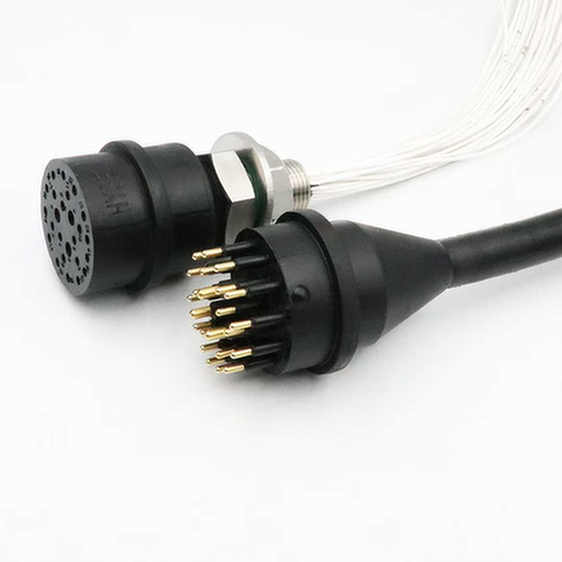
– ✅ Wet-mate and dry-mate connectors (100m to 6000m depth)
– ✅ Titanium, super duplex, and 316L stainless options
– ✅ Hybrid connectors (power + signal + fiber)
– ✅ Custom engineering and manufacturing
– ✅ Fast delivery (2-3 weeks on standard products)
– ✅ Free samples for qualified projects
– ✅ Direct engineer support (12-hour response time)
Contact Us:
– 📧 Email: info@hysfsubsea.com
– 📞 Phone: +86 13942853869
– 🌐 Website: https://hysfsubsea.com
Download Resources:
- GOS Case Study (PDF)
- ROI Calculator (Excel)
- Connector Selection Guide (PDF)
Document Information:
– Version: 1.0
– Published: March 7, 2026
– Word Count: ~3,200 words
This case study is based on real customer results. Names and specific details have been changed for confidentiality. Contact HYSF Subsea for references from similar applications.


