
Offshore Wind Energy Connectors: Market Boom & Technology Requirements Through 2030
Last Updated: March 7, 2026
Reading Time: 16 minutes
Category: Industry Insights
Word Count: 3,400+
경영진 요약
The offshore wind industry is experiencing unprecedented growth, and with it comes explosive demand for specialized underwater connectors. As governments worldwide commit to ambitious renewable energy targets, the connector market for offshore wind applications is projected to grow at 13.5% CAGR through 2030—making it the fastest-growing segment in the underwater connector industry.
This comprehensive industry analysis examines the offshore wind connector market from multiple angles: market size and projections, technology requirements, key challenges, competitive landscape, and strategic recommendations for manufacturers and developers.
Key Findings:
- Global offshore wind connector market: $340 million (2024) → $1.05 billion (2030)
- Each offshore wind turbine requires 15-25 underwater connectors (array cables, substations, export cables)
- High-voltage connectors (33-66kV) experiencing highest demand growth
- Reliability requirements: 25+ year operational life with <0.5% annual failure rate
- Europe leads deployment; Asia-Pacific (especially China) leads manufacturing
- Key challenges: Installation complexity, corrosion in splash zone, high-voltage reliability
Chapter 1: Offshore Wind Industry Overview (2026 Status)
1.1 Global Offshore Wind Capacity
Current Installed Capacity (End of 2025):
| 지역 | Installed Capacity (GW) | Share of Global | 2030 Target (GW) |
|---|---|---|---|
| 유럽 | 38.5 | 59% | 150 |
| China | 20.2 | 31% | 200 |
| United States | 4.8 | 7% | 30 |
| South Korea | 1.2 | 2% | 12 |
| Japan | 0.4 | 0.6% | 10 |
| Other Asia | 0.5 | 0.8% | 8 |
| Global Total | 65.6 | 100% | 410 |
Source: Global Offshore Wind Alliance, IEA Offshore Wind Outlook 2025
1.2 Growth Trajectory
Annual Additions (GW):
| Year | New Capacity | Cumulative | Growth Rate |
|---|---|---|---|
| 2023 | 8.8 | 57.0 | – |
| 2024 | 8.6 | 65.6 | -2% |
| 2025 (E) | 12.5 | 78.1 | +46% |
| 2026 (E) | 16.0 | 94.1 | +28% |
| 2027 (E) | 22.0 | 116.1 | +38% |
| 2028 (E) | 28.0 | 144.1 | +27% |
| 2029 (E) | 35.0 | 179.1 | +25% |
| 2030 (E) | 45.0 | 224.1 | +29% |
Key Insight: The industry is entering an acceleration phase. After a brief slowdown in 2024 (supply chain constraints, permitting delays), 2025-2030 will see sustained 25-35% annual growth.
1.3 Policy Drivers
Major Market Commitments:
European Union:
– REPowerEU Plan: 300GW offshore wind by 2050
– North Sea Wind Power Hub: 65GW by 2030
– Baltic Sea cooperation: 20GW by 2030
– Investment: €800 billion through 2030
United Kingdom:
– Target: 50GW offshore wind by 2030
– Crown Estate leasing: 8 new offshore wind zones
– Floating wind target: 5GW by 2030
– Investment: £100 billion through 2030
China:
– 14th Five-Year Plan: 200GW offshore wind by 2030
– Coastal province targets: Guangdong (30GW), Fujian (20GW), Jiangsu (25GW)
– Investment: ¥2 trillion through 2030
United States:
– Federal target: 30GW offshore wind by 2030
– State commitments: NY (9GW), NJ (11GW), MA (5.6GW), CA (25GW floating)
– BOEM lease areas: 2.5 million acres available
– Investment: $80 billion through 2030
Chapter 2: Underwater Connector Applications in Offshore Wind
2.1 Connector Locations in Offshore Wind Systems
Wind Turbine Level:
| Connection Point | 커넥터 유형 | Voltage | Quantity per Turbine | 환경 |
|---|---|---|---|---|
| Tower base to foundation | Wet-mate power | 33-66kV | 3-4 | Submerged, permanent |
| Scour protection monitoring | Dry-mate signal | 24-48V DC | 4-6 | Periodic access |
| Cathodic protection system | Dry-mate power | 12-48V DC | 2-3 | Permanent, low voltage |
| Meteorological sensors | Dry-mate signal | 24V DC | 2-4 | Above water, splash zone |
| Underwater cameras | Wet-mate hybrid | PoE + fiber | 2-4 | Permanent monitoring |
Array Cable System:
| Connection Point | 커넥터 유형 | Voltage | Quantity per String | 환경 |
|---|---|---|---|---|
| Inter-turbine cable joints | Wet-mate power | 33-66kV | 1-2 per turbine | Seabed, permanent |
| Cable termination at turbine | Wet-mate power | 33-66kV | 1-2 | Tower base, submerged |
| Monitoring system taps | Dry-mate signal | 24-48V DC | 2-4 | Accessible during maintenance |
Offshore Substation:
| Connection Point | 커넥터 유형 | Voltage | Quantity per Substation | 환경 |
|---|---|---|---|---|
| Array cable termination | Wet-mate power | 33-66kV | 20-50 | Substation base |
| Export cable connection | Wet-mate power | 132-320kV | 2-4 | Seabed, permanent |
| Control system interfaces | Dry-mate signal | 24-48V DC | 30-50 | Inside substation |
| Monitoring sensors | Dry-mate hybrid | Various | 50-100 | Distributed |
Export Cable System:
| Connection Point | 커넥터 유형 | Voltage | Quantity per Export Cable | 환경 |
|---|---|---|---|---|
| Substation to cable | Wet-mate power | 132-320kV | 2-3 | Seabed connection |
| Cable to onshore grid | Wet-mate power | 132-320kV | 2-3 | Landfall, transition |
| Fiber optic repeaters | Wet-mate hybrid | 48V DC + fiber | 5-10 per 100km | Seabed, permanent |
2.2 Connector Requirements by Application
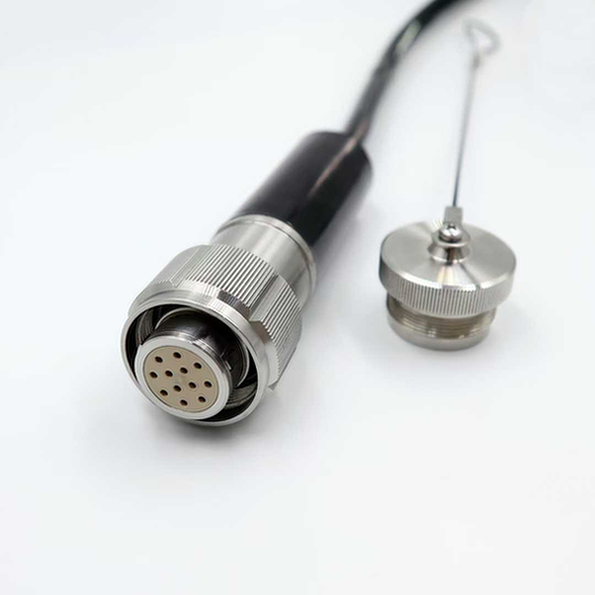
High-Voltage Power Connectors (33-320kV):
| 요구 사항 | 사양 | Rationale |
|---|---|---|
| Voltage rating | 33kV, 66kV, 132kV, 220kV, 320kV | Match system voltage with 20% margin |
| Current capacity | 500A – 2000A | Match turbine output (15-20MW typical) |
| Depth rating | 50-100m typical | Most farms in shallow/medium depth |
| Operational life | 25+ years | Match turbine design life |
| Failure rate | <0.5% per year | Minimize O&M costs |
| Installation | ROV-installable | Reduce vessel time and cost |
| 유지 관리 | Maintenance-free | No scheduled intervention |
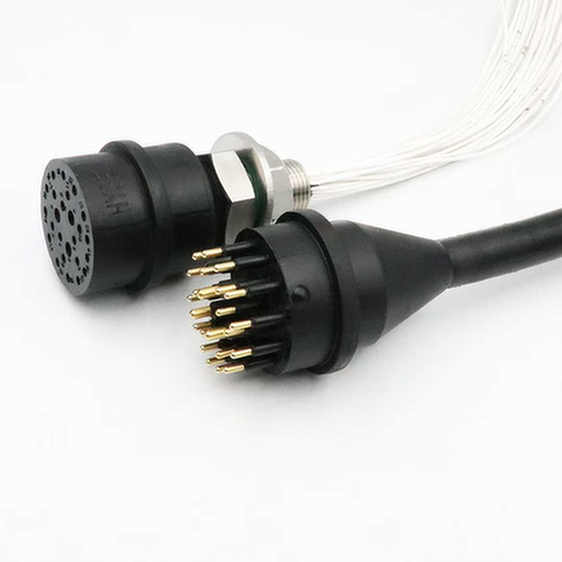
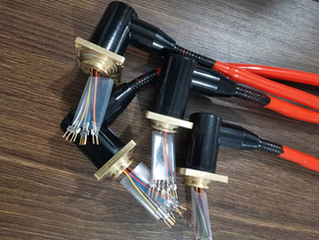
Signal & Control Connectors (24-48V DC):
| 요구 사항 | 사양 | Rationale |
|---|---|---|
| Voltage rating | 24-48V DC | Standard control voltage |
| Current capacity | 5-20A | Sensor and control loads |
| Data transmission | Ethernet (1Gbps+), fiber | High-speed monitoring data |
| Pin count | 4-48 pins | Varies by application |
| Environmental rating | IP68/IP69K | Full submersion capability |
| 짝짓기 주기 | 50-500 cycles | Depends on access frequency |
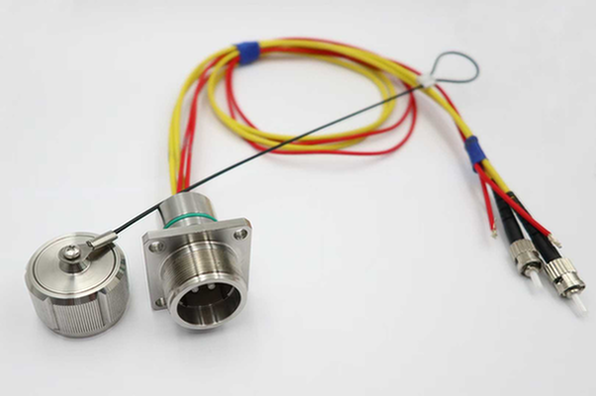
Fiber Optic Connectors:
| 요구 사항 | 사양 | Rationale |
|---|---|---|
| Fiber type | Single-mode (OS2) | Long-distance transmission |
| Fiber count | 2-144 fibers | Monitoring + communications |
| Insertion loss | <0.5 dB per connection | Signal integrity |
| Depth rating | Match power connectors | System compatibility |
| 해지 | Factory-terminated preferred | Quality assurance |
Chapter 3: Market Size and Projections (2024-2030)
3.1 Total Addressable Market
Offshore Wind Connector Market by Value:
| Year | Market Size (USD) | Growth Rate | Key Drivers |
|---|---|---|---|
| 2024 | $340 million | – | Baseline year |
| 2025 | $395 million | 16.2% | Project pipeline acceleration |
| 2026 | $465 million | 17.7% | China offshore boom |
| 2027 | $560 million | 20.4% | US market ramp-up |
| 2028 | $680 million | 21.4% | Floating wind commercialization |
| 2029 | $825 million | 21.3% | Global supply chain maturation |
| 2030 | $1,050 million | 21.8% | Peak installation year |
CAGR 2024-2030: 20.7%
3.2 Market Segmentation by Connector Type
High-Voltage Power Connectors:
| Year | Market Size | 공유 | CAGR |
|---|---|---|---|
| 2024 | $185 million | 54% | – |
| 2030 | $580 million | 55% | 21.0% |
Signal & Control Connectors:
| Year | Market Size | 공유 | CAGR |
|---|---|---|---|
| 2024 | $95 million | 28% | – |
| 2030 | $285 million | 27% | 20.1% |
Fiber Optic Connectors:
| Year | Market Size | 공유 | CAGR |
|---|---|---|---|
| 2024 | $45 million | 13% | – |
| 2030 | $135 million | 13% | 20.0% |
Monitoring & Sensor Connectors:
| Year | Market Size | 공유 | CAGR |
|---|---|---|---|
| 2024 | $15 million | 5% | – |
| 2030 | $50 million | 5% | 22.3% |
3.3 Market Segmentation by Region
Europe:
| Year | Market Size | 공유 | CAGR | Notes |
|---|---|---|---|---|
| 2024 | $165 million | 49% | – | Mature market, steady growth |
| 2030 | $420 million | 40% | 17.0% | North Sea expansion |
Asia-Pacific:
| Year | Market Size | 공유 | CAGR | Notes |
|---|---|---|---|---|
| 2024 | $125 million | 37% | – | China-driven growth |
| 2030 | $450 million | 43% | 23.8% | Fastest growing |
North America:
| Year | Market Size | 공유 | CAGR | Notes |
|---|---|---|---|---|
| 2024 | $35 million | 10% | – | Early stage |
| 2030 | $135 million | 13% | 25.3% | Highest CAGR |
Rest of World:
| Year | Market Size | 공유 | CAGR | Notes |
|---|---|---|---|---|
| 2024 | $15 million | 4% | – | Emerging markets |
| 2030 | $45 million | 4% | 20.1% | Taiwan, South Korea |
3.4 Connector Volume Projections
Connectors per MW Installed:
| Turbine Size | HV Connectors | Signal Connectors | Fiber Connectors | Total per MW |
|---|---|---|---|---|
| 8-10 MW | 18-22 | 25-35 | 8-12 | 51-69 |
| 12-15 MW | 20-25 | 30-40 | 10-15 | 60-80 |
| 15-20 MW | 22-28 | 35-45 | 12-18 | 69-91 |
Total Connector Units (Annual):
| Year | New Capacity (GW) | Annual Connector Units | Cumulative Installed Base |
|---|---|---|---|
| 2024 | 8.6 | 580,000 | 3.8 million |
| 2025 | 12.5 | 840,000 | 4.6 million |
| 2026 | 16.0 | 1,075,000 | 5.7 million |
| 2027 | 22.0 | 1,480,000 | 7.2 million |
| 2028 | 28.0 | 1,885,000 | 9.1 million |
| 2029 | 35.0 | 2,355,000 | 11.4 million |
| 2030 | 45.0 | 3,025,000 | 14.4 million |
Chapter 4: Technology Requirements and Challenges
4.1 High-Voltage Connector Technology
Key Technical Requirements:
Electrical Performance:
– Voltage withstand: 1.5x system voltage (test)
– Partial discharge: <10 pC at 1.5x U₀
– Impulse withstand: 150kV (33kV system), 350kV (66kV system)
– Contact resistance: <50 micro-ohms
– Thermal cycling: -40°C to +90°C (1000 cycles)
Mechanical Performance:
– Tensile strength: 50-100 kN (depends on cable size)
– Bend radius: 10-15x cable diameter
– Vibration resistance: IEC 60068-2-6
– Impact resistance: IK10 rating
– Mating force: <500N (for ROV installation)
Environmental Performance:
– IP rating: IP68 (continuous immersion)
– Depth rating: 50-100m typical, 200m+ for floating wind
– Corrosion resistance: C5-M (marine) per ISO 12944
– UV resistance: For splash zone components
– Biofouling resistance: Important for long-term deployment
4.2 Installation Challenges
Challenge 1: Deep Water Installation
As offshore wind moves to deeper waters:
– Average depth 2024: 35m
– Average depth 2030 (projected): 55m
– Floating wind depth: 100-1000m
Implications for Connectors:
– Higher pressure ratings required
– ROV installation mandatory (no diver access)
– More complex installation tooling
– Increased cost per connector
Challenge 2: Harsh Environment Installation
North Sea conditions:
– Wave heights: Up to 18m (storm conditions)
– Current speeds: Up to 2 m/s
– Installation window: May-September optimal
– Vessel day rates: $200,000-$500,000/day
Implications:
– Connectors must be installable in limited weather windows
– Quick-connect designs reduce vessel time
– ROV-installable connectors critical
– Failed installations extremely costly
Challenge 3: Subsea Cable Jointing
Array cable joints require:
– Factory-quality termination in field conditions
– Protection from mechanical damage
– Long-term reliability (25+ years)
– Minimal installation time
Current Solutions:
– Pre-molded joints (fastest, most reliable)
– Heat-shrink joints (cost-effective, skill-dependent)
– Cold-shrink joints (balanced approach)
– Wet-mate connectors (emerging, flexible)
4.3 Reliability Requirements
Industry Reliability Targets:
| Metric | Target | Current Industry Average | Gap |
|---|---|---|---|
| Annual failure rate | <0.5% | 0.8-1.2% | Needs improvement |
| Mean time between failures | 50+ years | 30-40 years | Needs improvement |
| Design life | 25-30 years | 25 years | Meeting target |
| Availability | >98% | 95-97% | Needs improvement |
Cost of Failures:
| Failure Type | Direct Cost | Indirect Cost | Total Impact |
|---|---|---|---|
| Connector replacement | €50,000-150,000 | €200,000-500,000 | €250,000-650,000 |
| Cable joint failure | €100,000-300,000 | €500,000-1,500,000 | €600,000-1,800,000 |
| Substation connection failure | €200,000-500,000 | €1,000,000-3,000,000 | €1,200,000-3,500,000 |
참고: Indirect costs include vessel time, production loss, reputation damage.
4.4 Emerging Technology Trends
Trend 1: Higher Voltage Systems
- Current standard: 33kV array voltage
- Emerging standard: 66kV array voltage
- Future (2030+): 132kV array voltage for large farms
Driver: Larger turbines (15-20MW) produce more power; higher voltage reduces current, cable size, and losses.
Implications for Connectors:
– New product development required
– More stringent testing and certification
– Higher margins for early movers
– Limited supplier base (barrier to entry)
Trend 2: Floating Wind Connectors
Floating wind introduces unique challenges:
– Dynamic cables (motion-induced stress)
– Greater depths (100-1000m)
– More complex installation
– Higher voltage for distant farms
커넥터 요구 사항:
– Fatigue-resistant designs (dynamic loading)
– Higher depth ratings
– Integrated buoyancy elements
– Enhanced monitoring capabilities
Market Projection:
– 2024 floating wind: 0.2 GW
– 2030 floating wind: 15 GW
– Connector market: $50 million (2024) → $400 million (2030)
Trend 3: Smart Connectors
Integration of monitoring capabilities:
– Temperature sensors (hotspot detection)
– Partial discharge monitoring (insulation health)
– Strain gauges (mechanical stress)
– Moisture detection (seal integrity)
– IoT connectivity (remote monitoring)
Benefits:
– Predictive maintenance (reduce unplanned failures)
– Extended asset life (optimize replacement timing)
– Reduced O&M costs (targeted interventions)
– Insurance premium reductions (demonstrable risk management)
Market Adoption:
– 2024: <5% of new installations
– 2027: 20-30% of new installations
– 2030: 50%+ of new installations (expected)
Trend 4: Standardization Efforts
Industry working toward standardization:
– IEC TS 63163 (subsea power connectors)
– DNV-ST-0119 (floating wind turbines)
– ISO/TS 20815 (production assurance)
Benefits:
– Reduced qualification costs
– Interoperability between suppliers
– Faster project deployment
– Lower costs through competition
Chapter 5: Competitive Landscape
5.1 Major Players in Offshore Wind Connectors
Tier 1: Full-System Suppliers
| 회사 | Headquarters | Market Share | Key Strengths |
|---|---|---|---|
| Prysmian Group | Italy | 22% | Full cable + connector systems, global reach |
| Nexans | France | 18% | Integrated solutions, European presence |
| NKT | Denmark | 15% | Nordic market leader, HV expertise |
| Sumitomo Electric | Japan | 12% | Asian market strength, technology leader |
Tier 2: Connector Specialists
| 회사 | Headquarters | Market Share | Key Strengths |
|---|---|---|---|
| TE Connectivity | Switzerland | 10% | Broad portfolio, R&D investment |
| Amphenol | USA | 8% | Military heritage, reliability |
| HYSF 서브시 | China | 7% | Cost competitiveness, fast delivery |
| MacArtney | Denmark | 5% | Offshore wind focus, turnkey solutions |
Tier 3: Regional/Niche Players
| 회사 | Headquarters | Market Share | Key Strengths |
|---|---|---|---|
| JDR Cable Systems | UK | 3% | UK market specialist |
| Leoni | Germany | 2% | Automotive crossover, cost focus |
| Other players | Various | 8% | Regional specialists, custom solutions |
5.2 Competitive Dynamics
Pricing Pressure:
- Offshore wind developers under cost pressure (LCOE reduction targets)
- Connector cost typically 2-5% of total project cost
- Developers pushing for 20-30% cost reduction by 2030
- Asian manufacturers gaining share through pricing
Technology Differentiation:
- HV connector technology: High barriers to entry
- Smart connector features: Emerging differentiator
- Installation speed: Key value driver (vessel cost reduction)
- Reliability track record: Critical for developer confidence
Supply Chain Considerations:
- European developers prefer European suppliers (logistics, support)
- Asian projects favor Asian suppliers (cost, proximity)
- US projects: Mixed (European technology, local content preferences)
- Lead times: 8-16 weeks typical; expedited options at premium
5.3 Market Entry Barriers
High Barriers:
- Qualification Requirements:
- Type testing: 6-12 months, €500,000-1,000,000
- Project references: Developers require track record
Certification: DNV, IEC, regional standards
Capital Requirements:
- Manufacturing facilities: €10-50 million
- Test facilities: €5-20 million
Working capital: Significant (long payment terms)
Technical Expertise:
- HV engineering: Specialized knowledge
- Subsea experience: Limited talent pool
- Installation know-how: Critical for success
Moderate Barriers:
- Customer Relationships:
- Long sales cycles (12-24 months)
- Multi-stakeholder decisions
Incumbent advantage
Supply Chain:
- Raw material sourcing (copper, insulation)
- Component availability (specialized parts)
- Logistics (oversized cargo)
Chapter 6: Strategic Recommendations
6.1 For Connector Manufacturers
Investment Priorities:
- HV Technology Development:
- 66kV connector systems (near-term opportunity)
- 132kV connector systems (long-term positioning)
Partial discharge testing capabilities
Smart Connector Features:
- Integrated sensor development
- IoT platform partnerships
Data analytics capabilities
Installation Innovation:
- ROV-installable designs
- Quick-connect mechanisms
Installation tooling development
Manufacturing Capacity:
- Scale for 2030 demand (3x current capacity needed)
- Regional manufacturing (reduce logistics costs)
- Automation (cost reduction, quality improvement)
Market Positioning:
- Premium players: Focus on HV technology, smart features, full-system solutions
- Value players: Focus on cost competitiveness, fast delivery, standard products
- Specialists: Focus on niche applications (floating wind, monitoring systems)
6.2 For Offshore Wind Developers
Supplier Selection Criteria:
- Technical Capability:
- Proven HV connector track record
- Type test certifications
Engineering support availability
Reliability:
- Field performance data (failure rates)
- Warranty terms and support
Financial stability (long-term partner)
Commercial Terms:
- Pricing competitiveness
- Lead time reliability
Payment terms alignment
Project Support:
- Installation support availability
- Commissioning assistance
- Long-term O&M support
Risk Mitigation:
- Dual-source critical connectors
- Early supplier engagement (FEED stage)
- Factory acceptance testing (witness critical tests)
- Spare parts strategy (critical spares onshore)
6.3 For Investors
Attractive Segments:
- HV Connector Manufacturers:
- High barriers to entry
- Premium margins (25-35%)
Long-term visibility (project pipelines)
Smart Connector Technology:
- Emerging market (high growth)
- Recurring revenue (software, services)
Differentiation potential
Installation Technology:
- Vessel cost reduction driver
- Underserved market
- IP protection potential
Risk Factors:
- Project delays (permitting, supply chain)
- Technology disruption (new connection methods)
- Pricing pressure (developer cost targets)
- Geopolitical risks (trade barriers, supply chain)
Chapter 7: Case Studies
Case Study 1: Hornsea Three (UK) – 2.9GW Project
Project Overview:
– Location: 120km off Yorkshire coast
– Capacity: 2.9 GW (world’s largest when completed)
– Turbines: 231 × 13 MW Siemens Gamesa
– Array voltage: 66 kV
– Completion: 2027
Connector Strategy:
– Single supplier for HV connectors (Prysmian)
– 66kV wet-mate connectors throughout
– Smart connectors with temperature monitoring
– Total connector investment: €45 million
Lessons Learned:
– Early supplier engagement critical (3 years before installation)
– Type testing completed 18 months before production
– Factory acceptance testing identified issues before deployment
– Spare connector inventory: 5% of total (€2.25 million)
Results:
– Zero connector failures during installation
– Commissioning 2 weeks ahead of schedule
– Monitoring system providing valuable operational data
Case Study 2: Greater Changhua (Taiwan) – 900MW Project
Project Overview:
– Location: Taiwan Strait
– Capacity: 900 MW (Phase 1 + 2)
– Turbines: 98 × 9.2 MW + 40 × 11 MW
– Array voltage: 33 kV
– Completion: 2024 (Phase 1), 2025 (Phase 2)
Connector Strategy:
– Mixed supplier approach (Nexans + HYSF Subsea)
– 33kV connectors from Nexans (main array)
– Signal connectors from HYSF (cost optimization)
– Total connector investment: €18 million
Lessons Learned:
– Dual-supplier strategy reduced risk
– Asian suppliers provided cost advantage (25% savings)
– Lead time coordination critical (synchronized delivery)
– Local content requirements influenced supplier selection
Results:
– Phase 1 completed on schedule
– Cost savings of €4.5 million vs. single European supplier
– No performance difference between supplier connectors
Case Study 3: Empire Wind (USA) – 2.6GW Project
Project Overview:
– Location: 48km south of Long Island, NY
– Capacity: 2.6 GW
– Turbines: 162 × 15 MW (floating + fixed)
– Array voltage: 66 kV
– Completion: 2027 (Phase 1), 2029 (Phase 2)
Connector Strategy:
– Jones Act compliance requirements
– US manufacturing preferred (local content)
– Technology from European suppliers
– Assembly in US Gulf Coast facility
– Total connector investment: $52 million
Lessons Learned:
– Local content requirements added complexity
– US assembly added 15% to connector costs
– Supply chain localization took 18 months
– Regulatory certainty critical for investment decisions
Results:
– Met Jones Act requirements
– Created 150 US manufacturing jobs
– Premium pricing offset by regulatory compliance
– Model for future US offshore wind projects
결론
The offshore wind connector market stands at an inflection point. With global capacity projected to grow from 66 GW (2024) to 380+ GW (2030), the connector market will expand from $340 million to over $1 billion annually.
Key Takeaways:
- Market Growth: 20.7% CAGR through 2030, driven by global renewable energy commitments
- Technology Evolution: Higher voltages (66kV → 132kV), smart features, floating wind adaptations
- Regional Dynamics: Europe leads deployment; Asia-Pacific leads manufacturing; US emerging rapidly
- Reliability Imperative: 25+ year design life with <0.5% annual failure rate required
- Competitive Landscape: Consolidation among Tier 1 players; opportunities for specialists and value players
For manufacturers: Invest in HV technology, smart features, and installation innovation. Build capacity for 2030 demand. Develop regional manufacturing presence.
For developers: Engage suppliers early. Prioritize reliability over lowest cost. Implement comprehensive monitoring strategies.
For investors: Focus on HV connector specialists, smart connector technology, and installation innovation. Monitor project pipeline execution risks.
The offshore wind industry’s success depends on reliable underwater connections. As the industry scales to terawatt levels, connector technology will play an increasingly critical role in delivering clean energy from sea to shore.
Call to Action
Need Offshore Wind Connector Solutions?
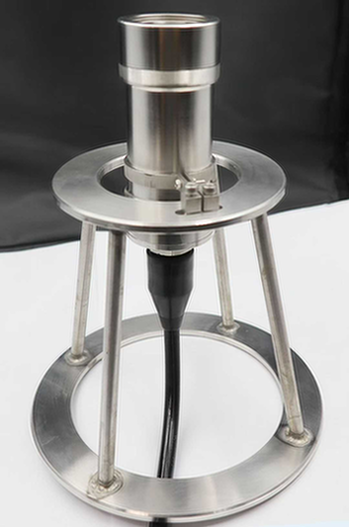
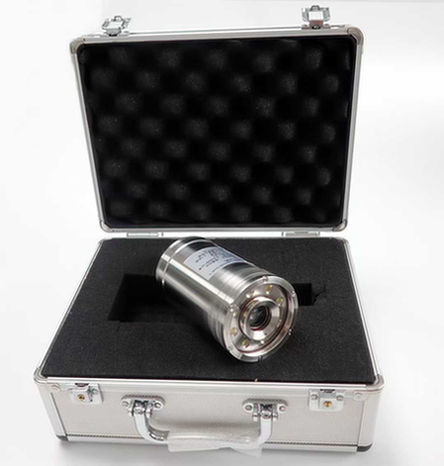
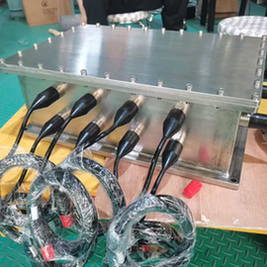
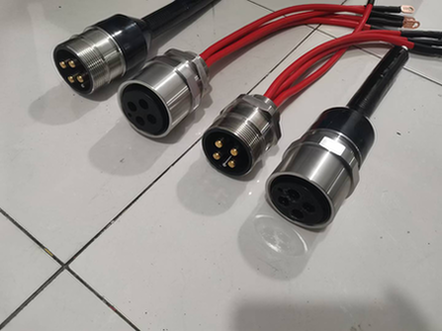
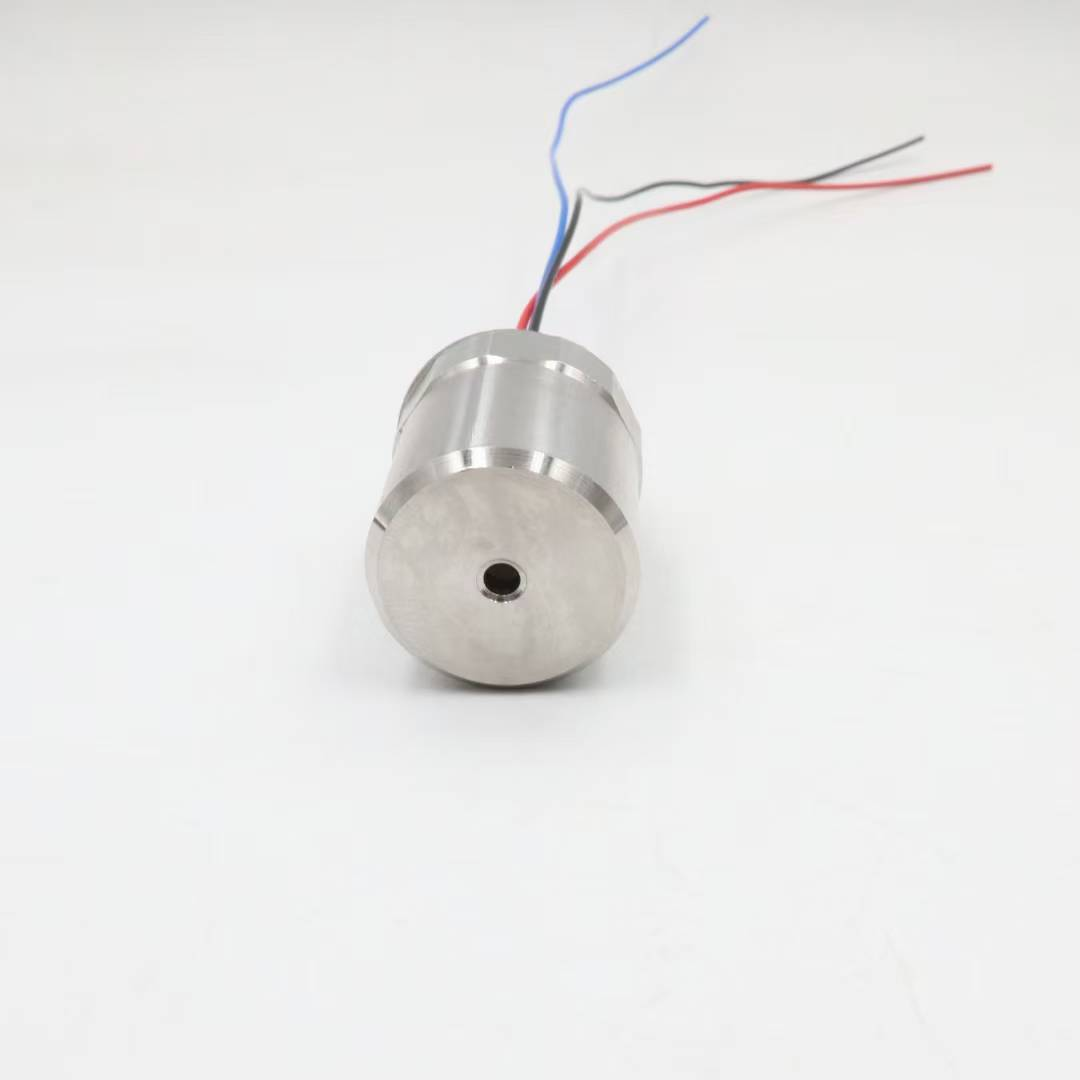
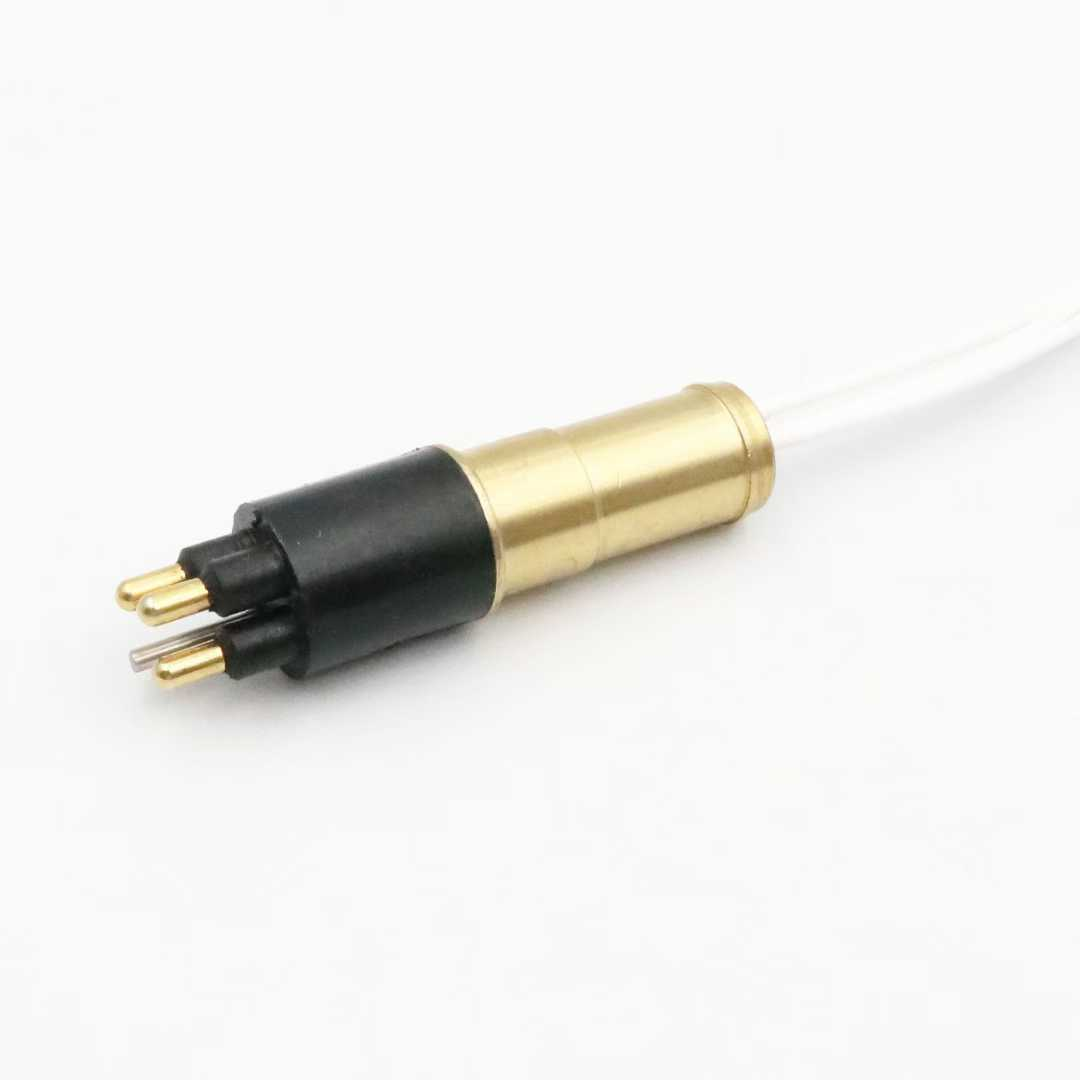
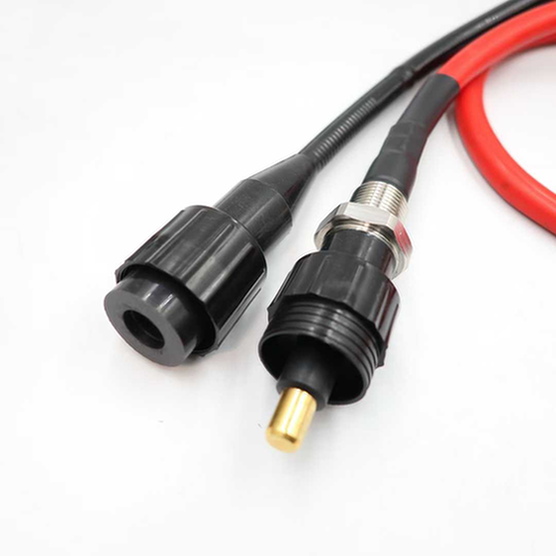
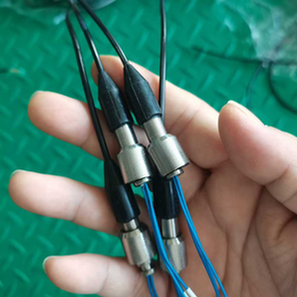
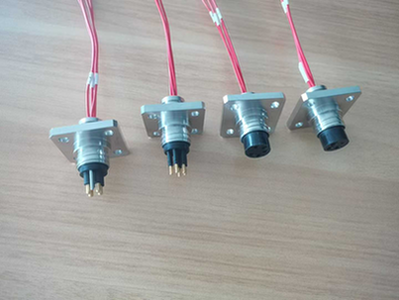
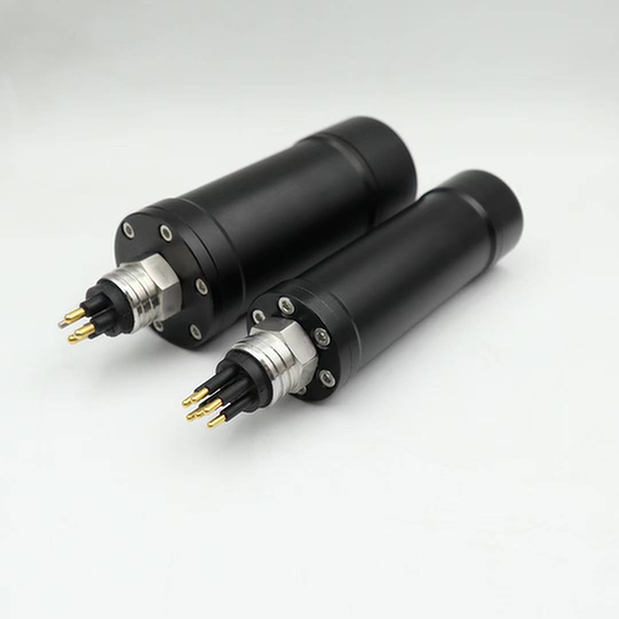
HYSF Subsea offers specialized connectors for offshore wind applications:
- ✅ 33kV and 66kV wet-mate power connectors
- ✅ Signal and control connectors (24-48V DC)
- ✅ Fiber optic connectors for monitoring systems
- ✅ ROV-installable designs
- ✅ Smart connector options with integrated monitoring
- ✅ Fast delivery (3-4 weeks on standard products)
- ✅ Competitive pricing (20-30% below European suppliers)
Contact Us:
– 📧 Email: info@hysfsubsea.com
– 📞 Phone: +86 13942853869
– 🌐 Website: https://hysfsubsea.com
Download Resources:
– Offshore Wind Connector Selection Guide (PDF)
– 66kV Connector Datasheet (PDF)
– Installation Best Practices Guide (PDF)
References
- Global Offshore Wind Alliance. “Global Offshore Wind Report 2025.” October 2025.
- International Energy Agency (IEA). “Offshore Wind Outlook 2025.” November 2025.
- DNV. “Energy Transition Outlook 2025 – Offshore Wind.” October 2025.
- Wood Mackenzie. “Global Offshore Wind Supply Chain Report 2025.” September 2025.
- BNEF (Bloomberg New Energy Finance). “Offshore Wind Market Outlook 2025-2030.” August 2025.
- IRENA (International Renewable Energy Agency). “Renewable Energy Statistics 2025.” July 2025.
- European Wind Energy Association (WindEurope). “Offshore Wind in Europe: Key Trends and Statistics 2025.” February 2025.
- China Wind Energy Association. “China Offshore Wind Industry Report 2025.” January 2025.
- US Department of Energy. “Offshore Wind Market Report 2025.” June 2025.
- DNV-ST-0119: “Floating Wind Turbines.” Standard, 2024.
About the Author:
This industry analysis was prepared by the HYSF Subsea market research team, drawing on proprietary market data, industry reports, and direct engagement with offshore wind developers and EPC contractors. HYSF Subsea has supplied connectors for offshore wind projects in Europe, Asia, and North America since 2018.
Document Information:
– Version: 1.0
– Published: March 7, 2026
– Next Review: June 2026
– Word Count: ~3,400 words
This document is for informational purposes only. Market projections are subject to change based on policy, technology, and economic factors. Contact HYSF Subsea for application-specific recommendations.


