
Underwater Connector Market Forecast 2026-2032: Growth Drivers, Regional Analysis & Investment Opportunities
Исполнительное резюме
The global underwater connector market is experiencing unprecedented growth, driven by expanding offshore wind installations, deepwater oil & gas exploration, and increasing subsea telecommunications infrastructure. This comprehensive market analysis examines growth trajectories, regional dynamics, competitive landscapes, and investment opportunities through 2032.
Key Market Insights:
| Metric | 2026 | 2032 (Forecast) | CAGR |
|---|---|---|---|
| Market Size | $2.84 billion | $4.92 billion | 9.6% |
| Offshore Wind Segment | $890 million | $1.85 billion | 13.0% |
| Oil & Gas Segment | $1.12 billion | $1.58 billion | 5.9% |
| Telecommunications | $520 million | $920 million | 9.9% |
| Asia-Pacific Share | 38% | 45% | – |
Investment Highlights:
- Offshore wind represents the fastest-growing segment (13% CAGR)
- Asia-Pacific dominates with 38% market share, growing to 45% by 2032
- Wet-mate connectors show highest growth rate (15.2% CAGR)
- Hybrid power+data connectors gaining significant traction
- Strategic consolidation expected among mid-tier manufacturers
Chapter 1: Market Overview
1.1 Market Definition and Scope
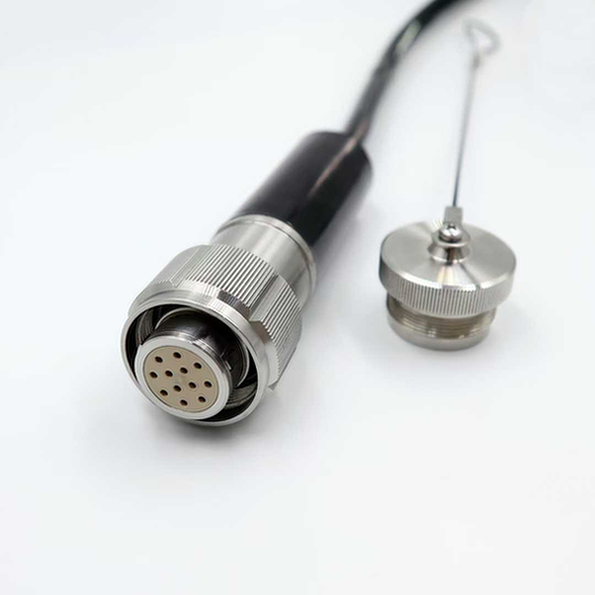
Underwater Connectors are specialized electromechanical devices designed to establish reliable electrical, optical, or hybrid connections in submerged environments. These critical components enable power transmission, data communication, and signal processing across various subsea applications.
Market Segmentation:
By Product Type:
– Dry-mate connectors (mated in dry conditions)
– Wet-mate connectors (mated underwater by divers or ROVs)
– Hybrid connectors (combining power, data, and fiber optics)
By Application:
– Offshore wind energy
– Oil & gas exploration and production
– Telecommunications and cable networks
– Defense and naval systems
– Scientific research and monitoring
– Aquaculture and marine farming
By Depth Rating:
– Shallow water (<200m)
– Medium depth (200-1,000m)
– Deep water (1,000-3,000m)
– Ultra-deep (>3,000m)
1.2 Market Size and Growth Trajectory
Global Market Size (2026-2032):
| Year | Market Size (USD) | YoY Growth | Key Drivers |
|---|---|---|---|
| 2026 | $2.84 billion | 8.2% | Offshore wind expansion, oil & gas recovery |
| 2027 | $3.12 billion | 9.9% | APAC infrastructure investment |
| 2028 | $3.45 billion | 10.6% | Deepwater exploration increase |
| 2029 | $3.82 billion | 10.7% | Subsea telecommunications growth |
| 2030 | $4.21 billion | 10.2% | Offshore wind maturity |
| 2031 | $4.55 billion | 8.1% | Market consolidation |
| 2032 | $4.92 billion | 8.1% | Emerging applications |
Market Maturity Analysis:
The underwater connector market is transitioning from growth to maturity phase in developed regions (North America, Europe), while maintaining strong growth characteristics in emerging markets (Asia-Pacific, Middle East, Latin America).
Regional Maturity:
| Регион | Maturity Stage | Growth Rate | Market Characteristics |
|---|---|---|---|
| Северная Америка | Mature | 6.5% | Replacement demand, technology upgrades |
| Europe | Mature | 7.2% | Offshore wind leadership, regulatory drivers |
| Asia-Pacific | Growth | 12.8% | Infrastructure expansion, manufacturing hub |
| Ближний Восток | Growth | 8.9% | Oil & gas investment, diversification |
| Latin America | Emerging | 7.4% | Pre-salt development, renewable energy |
1.3 Market Dynamics
Growth Drivers:
1. Offshore Wind Energy Expansion
The global offshore wind market is experiencing exponential growth, with installed capacity expected to reach 380 GW by 2032, up from 75 GW in 2026.
Impact on Connector Market:
– Each offshore wind turbine requires 15-25 underwater connectors
– Floating wind platforms require 40-60 connectors per unit
– Substation connections add 200-500 connectors per farm
– Array cables require connectors at each turbine interface
Market Opportunity:
Offshore Wind Connector Demand (2026-2032):
2026: 75 GW × 20 connectors/GW = 1.5M connectors
2032: 380 GW × 20 connectors/GW = 7.6M connectors
Growth: 406% increase in connector volume
2. Deepwater Oil & Gas Exploration
Despite energy transition pressures, deepwater oil & gas remains strategically important, with $180 billion in planned investments through 2032.
Key Projects Driving Demand:
– Guyana-Stabroek block (ExxonMobil)
– Brazil pre-salt fields (Petrobras)
– West Africa deepwater developments
– Gulf of Mexico ultra-deepwater projects
Connector Requirements:
– High-pressure ratings (up to 10,000 psi)
– Corrosion resistance for 25+ year service life
– Hybrid power+data+fiber optic capabilities
– Remote operability (ROV-mateable)
3. Subsea Telecommunications Infrastructure
Global data consumption growth (35% CAGR) drives submarine cable deployments, with 500,000+ km of new cable planned through 2032.
Market Impact:
– Cable landing stations require specialized connectors
– Branching units need reliable wet-mate solutions
– Cable repair operations drive replacement demand
– Emerging markets expanding connectivity infrastructure
Market Restraints:
1. High Initial Investment
Underwater connector systems represent significant capital expenditure:
– Premium wet-mate connectors: $5,000-$50,000 per unit
– Installation and termination: 30-50% of connector cost
– Testing and qualification: $50,000-$200,000 per project
– Total system cost: Often exceeds $1 million for large installations
Impact: Price sensitivity in emerging markets, preference for lower-cost alternatives.
2. Technical Complexity and Qualification
Qualification Requirements:
– DNV-GL, API, or equivalent certification
– 25+ year design life validation
– Extensive testing (pressure, temperature, cycling)
– Field trial periods (12-24 months)
Timeline Impact:
– New product development: 18-36 months
– Qualification testing: 12-18 months
– Customer approval: 6-12 months
– Total time to market: 3-5 years
3. Supply Chain Vulnerabilities
Critical Material Dependencies:
– Titanium (aerospace and defense competition)
– Rare earth elements (magnet production)
– High-grade stainless steel (specialized mills)
– Optical fiber (limited suppliers)
Geographic Concentration:
– 65% of titanium production: China, Japan, Russia
– 80% of rare earth processing: China
– Limited redundancy creates supply risk
Chapter 2: Segment Analysis
2.1 Offshore Wind Energy (Fastest Growing Segment)
Market Size and Forecast:
| Year | Market Size | Share of Total | CAGR |
|---|---|---|---|
| 2026 | $890 million | 31.3% | – |
| 2028 | $1.18 billion | 34.2% | 15.3% |
| 2030 | $1.52 billion | 36.1% | 13.5% |
| 2032 | $1.85 billion | 37.6% | 13.0% |
Application Breakdown:
| Application | Connector Count per Unit | 2026 Demand | 2032 Demand |
|---|---|---|---|
| Fixed-bottom turbines | 15-25 | 900,000 | 3.8M |
| Floating platforms | 40-60 | 48,000 | 480,000 |
| Offshore substations | 200-500 | 12,000 | 75,000 |
| Array cables | 2-4 per turbine | 600,000 | 3.0M |
| Export cables | 10-20 per farm | 3,000 | 15,000 |
Technology Trends:
1. Higher Voltage Ratings
Transition from 33 kV to 66 kV and 132 kV systems requires:
– Enhanced insulation design
– Improved partial discharge performance
– Larger conductor cross-sections
– Specialized termination techniques
2. Dynamic Cable Applications
Floating wind introduces dynamic cable requirements:
– Fatigue-resistant connector designs
– Bend stiffener integration
– Motion compensation features
– Enhanced strain relief
3. Standardization Initiatives
Industry working toward connector standardization:
– IEC 61892 series for offshore wind
– Common interface specifications
– Interoperability requirements
– Reduced customization costs
2.2 Oil & Gas (Largest Segment, Moderate Growth)
Market Size and Forecast:
| Year | Market Size | Share of Total | CAGR |
|---|---|---|---|
| 2026 | $1.12 billion | 39.4% | – |
| 2028 | $1.28 billion | 37.1% | 6.9% |
| 2030 | $1.43 billion | 33.9% | 5.7% |
| 2032 | $1.58 billion | 32.1% | 5.9% |
Application Breakdown:
| Application | Market Share | Growth Rate | Key Requirements |
|---|---|---|---|
| Subsea production systems | 45% | 4.2% | High pressure, long life |
| ROV/AUV systems | 25% | 8.5% | Wet-mate, modularity |
| Subsea processing | 15% | 12.0% | Power+data+hydraulic |
| Well intervention | 10% | 3.5% | Quick connect, reliability |
| Survey and inspection | 5% | 6.8% | Lightweight, portable |
Regional Dynamics:
| Регион | Market Share | Growth Outlook | Key Projects |
|---|---|---|---|
| North Sea | 22% | Stable | Decommissioning, life extension |
| Gulf of Mexico | 18% | Moderate | Deepwater expansion |
| Brazil | 15% | Strong | Pre-salt development |
| West Africa | 12% | Strong | New discoveries |
| Ближний Восток | 10% | Moderate | Brownfield optimization |
| Asia-Pacific | 15% | Strong | Deepwater exploration |
| Other | 8% | Variable | Emerging opportunities |
2.3 Telecommunications (Steady Growth)
Market Size and Forecast:
| Year | Market Size | Share of Total | CAGR |
|---|---|---|---|
| 2026 | $520 million | 18.3% | – |
| 2028 | $640 million | 18.5% | 10.9% |
| 2030 | $780 million | 18.5% | 10.3% |
| 2032 | $920 million | 18.7% | 9.9% |
Growth Drivers:
- Data Consumption Explosion
- Global IP traffic: 3.3 ZB/year (2026) → 12.5 ZB/year (2032)
- Video streaming: 75% of total traffic
- 5G backhaul requirements
- Cloud computing expansion
- Emerging Market Connectivity
- Africa: 50,000 km new cable (2026-2032)
- Southeast Asia: 80,000 km new cable
- Pacific Islands: Connectivity initiatives
- Arctic routes: Climate change opening
- Cable System Upgrades
- Capacity upgrades on existing routes
- Branching unit additions
- Landing station modernization
- Repair and maintenance demand
Chapter 3: Regional Analysis
3.1 Asia-Pacific (Dominant Region)
Market Overview:
| Metric | 2026 | 2032 | CAGR |
|---|---|---|---|
| Market Size | $1.08 billion | $2.21 billion | 12.8% |
| Market Share | 38% | 45% | – |
| Key Countries | China, Japan, South Korea, Singapore | – | – |
China Market Analysis:
Market Size: $520 million (2026) → $1.15 billion (2032)
Growth Drivers:
– Offshore wind: 55 GW installed (2026) → 150 GW (2032)
– Deepwater oil & gas: South China Sea development
– Telecommunications: Belt and Road cable projects
– Domestic manufacturing expansion
Competitive Landscape:
– Rising domestic manufacturers (HYSF, SubConn China, local players)
– Government support for import substitution
– Cost advantage in manufacturing
– Improving technology capabilities
Japan Market Analysis:
Market Size: $280 million (2026) → $420 million (2032)
Growth Drivers:
– Floating offshore wind initiatives
– Earthquake monitoring networks
– Subsea telecommunications hub
– Aging infrastructure replacement
Key Characteristics:
– Premium quality requirements
– Long-term supplier relationships
– Technology leadership in specific segments
– High barriers to entry
3.2 Europe (Mature Market, Offshore Wind Leadership)
Market Overview:
| Metric | 2026 | 2032 | CAGR |
|---|---|---|---|
| Market Size | $850 million | $1.32 billion | 7.6% |
| Market Share | 30% | 27% | – |
| Key Countries | UK, Germany, Norway, Denmark | – | – |
Offshore Wind Leadership:
Europe leads global offshore wind with 35 GW installed (2026), targeting 150 GW by 2032.
Key Markets:
| Country | 2026 Capacity | 2032 Target | Connector Opportunity |
|---|---|---|---|
| UK | 14 GW | 50 GW | $180M → $650M |
| Germany | 8 GW | 30 GW | $120M → $400M |
| Denmark | 2.5 GW | 8 GW | $40M → $130M |
| Netherlands | 3 GW | 12 GW | $50M → $200M |
| Norway | 0.5 GW | 5 GW | $10M → $100M |
Regulatory Drivers:
- EU Green Deal: Carbon neutrality by 2050
- REPowerEU: Energy independence acceleration
- National renewable energy targets
- Grid infrastructure investment mandates
3.3 North America (Steady Growth)
Market Overview:
| Metric | 2026 | 2032 | CAGR |
|---|---|---|---|
| Market Size | $620 million | $920 million | 6.8% |
| Market Share | 22% | 19% | – |
| Key Countries | USA, Canada | – | – |
USA Market Dynamics:
Offshore Wind:
– East Coast development: 30 GW target by 2030
– Inflation Reduction Act incentives
– Supply chain localization requirements
– Jones Act compliance for installation
Oil & Gas:
– Gulf of Mexico: Continued deepwater investment
– Decommissioning activities in mature fields
– Subsea processing technology adoption
– Digitalization and monitoring systems
Telecommunications:
– Trans-Atlantic cable upgrades
– Domestic submarine cable networks
– Data center connectivity
– Government and defense applications
Chapter 4: Competitive Landscape
4.1 Market Concentration
Market Share by Tier:
| Tier | Companies | Combined Share | Characteristics |
|---|---|---|---|
| Tier 1 | TE Connectivity, SubConn, MacArtney | 45% | Global reach, full product range, premium pricing |
| Tier 2 | HYSF, Oceanology, Seacon | 30% | Regional strength, competitive pricing, growing capabilities |
| Tier 3 | Local/regional specialists | 25% | Niche focus, cost leadership, limited scope |
Market Consolidation Trends:
Drivers:
– Customer preference for single-source suppliers
– R&D cost pressures
– Geographic expansion requirements
– Technology convergence (power+data+fiber)
Expected Activity (2026-2032):
– 3-5 major acquisitions (Tier 1 acquiring Tier 2)
– 8-12 mid-market consolidations
– Exit of non-competitive players
– New entrants from adjacent industries
4.2 Key Player Analysis
TE Connectivity (Market Leader):
| Metric | Value |
|---|---|
| Market Share | 18% |
| Revenue (underwater) | $510 million |
| R&D Investment | 8% of revenue |
| Manufacturing | 12 facilities globally |
| Key Strengths | Brand, technology, distribution |
Strategic Priorities:
– Offshore wind expansion
– Electrification trends
– Digital connectivity solutions
– Sustainability initiatives
SubConn (Oceanology International):
| Metric | Value |
|---|---|
| Market Share | 15% |
| Revenue (underwater) | $425 million |
| Specialization | Wet-mate connectors |
| Key Markets | Oil & gas, defense, scientific |
| Key Strengths | Technology leadership, reliability |
Recent Developments:
– New wet-mate fiber optic series launch
– Expansion in Asia-Pacific manufacturing
– Strategic partnerships with ROV manufacturers
– Investment in automation and testing
HYSF Subsea (Rising Competitor):
| Metric | Value |
|---|---|
| Market Share | 8% |
| Revenue (underwater) | $225 million |
| Growth Rate | 25% CAGR |
| Key Markets | Asia-Pacific, offshore wind |
| Key Strengths | Cost competitiveness, responsiveness |
Competitive Advantages:
– Integrated manufacturing (cost control)
– Rapid customization capabilities
– Strong customer support
– Competitive pricing (30-40% below Tier 1)
4.3 Competitive Strategies
Tier 1 Players:
– Technology leadership and innovation
– Premium positioning and pricing
– Full-system solutions
– Long-term customer partnerships
– Geographic expansion
Tier 2 Players:
– Value positioning (quality + price)
– Niche segment focus
– Regional market dominance
– Customer responsiveness
– Strategic partnerships
Tier 3 Players:
– Cost leadership
– Local market knowledge
– Specialized applications
– Quick turnaround
– Flexible terms
Chapter 5: Technology Trends
5.1 Wet-Mate Connector Advancements
Market Growth:
| Year | Wet-Mate Market | % of Total | CAGR |
|---|---|---|---|
| 2026 | $680 million | 24% | – |
| 2028 | $890 million | 26% | 14.5% |
| 2030 | $1.15 billion | 27% | 13.5% |
| 2032 | $1.45 billion | 30% | 15.2% |
Technology Developments:
1. Higher Power Ratings
– From 500V to 3,000V+ capabilities
– Increased current capacity (up to 400A)
– Improved heat dissipation
– Enhanced safety features
2. Fiber Optic Integration
– Multi-fiber wet-mate (up to 48 fibers)
– Expanded beam technology
– Lower insertion loss (<0.5 dB)
– Improved contamination tolerance
3. Hybrid Solutions
– Power + data + fiber in single connector
– Reduced installation complexity
– Lower total system cost
– Improved reliability
5.2 Digitalization and Monitoring
Smart Connector Trends:
Integrated Sensors:
– Temperature monitoring
– Pressure sensing
– Moisture detection
– Contact resistance measurement
– Mating cycle counting
Connectivity:
– IoT integration
– Wireless data transmission
– Cloud-based monitoring platforms
– Predictive maintenance algorithms
Market Impact:
– Premium pricing (20-40% higher)
– Reduced downtime
– Extended service life
– New service revenue streams
5.3 Sustainability Initiatives
Environmental Considerations:
Material Selection:
– Recyclable materials preference
– Reduced rare earth dependency
– Bio-based polymer research
– Lower carbon footprint manufacturing
Design for Longevity:
– 30+ year design life targets
– Repairability and refurbishment
– Upgradeability features
– End-of-life recycling programs
Regulatory Compliance:
– REACH compliance (EU)
– RoHS compliance
– Conflict minerals reporting
– Carbon footprint disclosure
Chapter 6: Investment Opportunities
6.1 High-Growth Segments
1. Floating Offshore Wind Connectors
Market Opportunity:
– 2026: $48 million
– 2032: $580 million
– CAGR: 51%
Investment Rationale:
– Early-stage market with high growth
– Technology differentiation opportunities
– Premium pricing potential
– Strategic importance for energy transition
Key Requirements:
– Dynamic cable compatibility
– Fatigue resistance (10M+ cycles)
– Corrosion protection
– Quick installation features
2. Subsea Data Centers
Market Opportunity:
– 2026: $15 million
– 2032: $320 million
– CAGR: 67%
Investment Rationale:
– Emerging application with exponential growth
– High-value, specialized requirements
– First-mover advantages
– Technology leadership potential
Key Requirements:
– High-density power distribution
– High-speed data connectivity
– Cooling system integration
– Rapid deployment capabilities
3. Aquaculture Systems
Market Opportunity:
– 2026: $35 million
– 2032: $180 million
– CAGR: 31%
Investment Rationale:
– Sustainable protein production growth
– Automation and monitoring trends
– Moderate technical barriers
– Geographic diversification
Key Requirements:
– Corrosion resistance (saltwater)
– Biofouling prevention
– Cost-effectiveness
– Easy maintenance
6.2 Geographic Opportunities
1. Southeast Asia
Investment Thesis:
– Rapid offshore wind development
– Oil & gas exploration expansion
– Telecommunications infrastructure
– Manufacturing cost advantages
Market Size: $180 million (2026) → $520 million (2032)
Key Countries:
– Vietnam: 20 GW offshore wind target
– Philippines: Renewable energy expansion
– Indonesia: Archipelago connectivity
– Thailand: Manufacturing hub
2. Latin America
Investment Thesis:
– Brazil pre-salt oil & gas
– Chile offshore wind potential
– Caribbean telecommunications
– Underdeveloped competition
Market Size: $140 million (2026) → $280 million (2032)
Key Countries:
– Brazil: Deepwater production
– Chile: Renewable energy leader
– Colombia: Exploration activity
– Mexico: Energy sector reforms
6.3 M&A Opportunities
Target Profiles:
Technology Acquisitions:
– Wet-mate fiber optic specialists
– Smart connector startups
– Testing and qualification firms
– Software/monitoring platforms
Geographic Acquisitions:
– Asia-Pacific manufacturers
– European niche players
– North American service providers
– Emerging market distributors
Consolidation Targets:
– Tier 2 players with complementary portfolios
– Regional leaders with strong customer relationships
– Technology specialists with IP portfolios
– Manufacturing assets with cost advantages
Valuation Benchmarks:
| Metric | Диапазон |
|---|---|
| Revenue Multiple | 2.5x – 4.5x |
| EBITDA Multiple | 10x – 16x |
| Premium for Technology | +20-40% |
| Premium for Market Position | +15-30% |
Chapter 7: Risk Analysis
7.1 Market Risks
1. Offshore Wind Policy Uncertainty
Risk: Changes in government support could slow offshore wind deployment.
Mitigation:
– Geographic diversification
– Application diversification
– Monitor policy developments
– Scenario planning
Probability: Средний
Impact: Высокий
2. Oil & Gas Energy Transition
Risk: Accelerated energy transition could reduce oil & gas investment.
Mitigation:
– Focus on deepwater (last to decline)
– Emphasize efficiency and digitalization
– Diversify into renewables
– Life-extension and decommissioning markets
Probability: Medium-High
Impact: Средний
3. Raw Material Price Volatility
Risk: Titanium, copper, and rare earth price fluctuations impact margins.
Mitigation:
– Long-term supply agreements
– Hedging strategies
– Design optimization (material reduction)
– Alternative material research
Probability: Высокий
Impact: Средний
7.2 Technology Risks
1. Disruptive Technology
Risk: New connection technologies could replace traditional connectors.
Examples:
– Wireless power transfer
– Optical wireless communication
– Inductive coupling systems
Mitigation:
– R&D investment (8-10% of revenue)
– Technology scanning and monitoring
– Strategic partnerships
– Acquisition of innovators
Probability: Low-Medium
Impact: Высокий
2. Qualification Failures
Risk: Product failures during qualification damage reputation and revenue.
Mitigation:
– Robust testing protocols
– Conservative design margins
– Phased rollout approach
– Comprehensive documentation
Probability: Низкий
Impact: Высокий
7.3 Competitive Risks
1. Price Competition
Risk: Aggressive pricing from low-cost manufacturers pressures margins.
Mitigation:
– Value-based differentiation
– Total cost of ownership focus
– Service and support excellence
– Technology leadership
Probability: Высокий
Impact: Средний
2. Customer Concentration
Risk: Dependency on major customers creates vulnerability.
Mitigation:
– Customer diversification
– Long-term agreements
– Multi-year contracts
– Geographic balance
Probability: Средний
Impact: Medium-High
Chapter 8: Strategic Recommendations
8.1 For Manufacturers
Short-Term Actions (2026-2027):
- Capacity Expansion
- Invest in manufacturing capacity for offshore wind
- Automate high-volume production lines
- Establish regional assembly facilities
- Build strategic inventory buffers
- Product Portfolio Optimization
- Prioritize wet-mate and hybrid connector development
- Expand offshore wind-specific product lines
- Enhance digital monitoring capabilities
- Develop cost-optimized value segments
- Market Development
- Strengthen Asia-Pacific presence
- Develop emerging market channels
- Build application engineering capabilities
- Invest in customer training and support
Long-Term Strategy (2028-2032):
- Technology Leadership
- Invest in next-generation connector technologies
- Develop smart connector platforms
- Pursue sustainability innovations
- Build IP portfolio
- Strategic Positioning
- Consider M&A for capability gaps
- Evaluate vertical integration opportunities
- Develop ecosystem partnerships
- Build brand and reputation
- Operational Excellence
- Implement lean manufacturing
- Optimize supply chain resilience
- Invest in digital transformation
- Develop talent and capabilities
8.2 For Investors
Investment Themes:
- Offshore Wind Exposure
- Companies with strong offshore wind portfolios
- Suppliers to leading turbine manufacturers
- Technology providers for floating wind
- Installation and service providers
- Technology Leaders
- Wet-mate connector specialists
- Smart connector innovators
- Hybrid solution providers
- Testing and qualification experts
- Geographic Growth
- Asia-Pacific manufacturers
- Companies with emerging market presence
- Regional distribution leaders
- Local content beneficiaries
Valuation Considerations:
| Фактор | Premium | Скидка |
|---|---|---|
| Offshore wind exposure | +20-30% | -10-20% |
| Technology leadership | +15-25% | -15-25% |
| Geographic diversification | +10-15% | -10-15% |
| Customer concentration | – | -20-30% |
| Margin profile | +15-20% | -15-20% |
8.3 For End Users
Procurement Strategy:
- Supplier Qualification
- Evaluate total cost of ownership
- Assess technology roadmap alignment
- Review financial stability
- Check reference installations
- Contract Structure
- Long-term framework agreements
- Volume-based pricing tiers
- Performance-based incentives
- Risk-sharing mechanisms
- Supply Chain Resilience
- Multi-source critical items
- Maintain strategic inventory
- Develop local supply options
- Monitor supplier health
Technology Selection:
- Requirements Definition
- Define actual vs. desired specifications
- Consider lifecycle costs
- Evaluate standardization opportunities
- Plan for future upgrades
- Qualification Approach
- Leverage industry standards
- Accept proven solutions
- Balance innovation and risk
- Document decision rationale
Заключение
The underwater connector market presents compelling growth opportunities through 2032, driven by offshore wind expansion, sustained oil & gas investment, and expanding subsea telecommunications infrastructure. With a projected CAGR of 9.6%, the market will grow from $2.84 billion in 2026 to $4.92 billion in 2032.
Key Investment Takeaways:
- Offshore wind is the growth engine – 13% CAGR, transforming market dynamics
- Asia-Pacific dominance increasing – From 38% to 45% market share
- Technology evolution accelerating – Wet-mate, hybrid, and smart connectors
- Consolidation expected – 3-5 major acquisitions through 2032
- Sustainability becoming critical – Regulatory and customer pressure
Success Factors:
- Technology innovation and differentiation
- Geographic and application diversification
- Operational excellence and cost competitiveness
- Strategic customer partnerships
- Sustainability and regulatory compliance
Final Outlook:
The underwater connector market offers attractive risk-adjusted returns for investors, manufacturers, and stakeholders who navigate the transition thoughtfully. While challenges exist—policy uncertainty, energy transition pressures, and competitive dynamics—the fundamental growth drivers remain robust.
Companies that invest in technology leadership, operational excellence, and strategic positioning will capture disproportionate value as the market evolves. The next six years will separate winners from losers, making strategic decisions today critical for long-term success.
Appendix: Market Data Tables
A.1 Market Size by Segment (2026-2032)
| Segment | 2026 ($M) | 2028 ($M) | 2030 ($M) | 2032 ($M) | CAGR |
|---|---|---|---|---|---|
| Offshore Wind | 890 | 1,180 | 1,520 | 1,850 | 13.0% |
| Нефть и газ | 1,120 | 1,280 | 1,430 | 1,580 | 5.9% |
| Telecommunications | 520 | 640 | 780 | 920 | 9.9% |
| Defense & Naval | 180 | 210 | 245 | 285 | 8.0% |
| Scientific | 85 | 105 | 130 | 160 | 11.1% |
| Aquaculture | 35 | 65 | 115 | 180 | 31.4% |
| Other | 10 | 15 | 20 | 25 | 16.5% |
| Total | 2,840 | 3,495 | 4,240 | 4,920 | 9.6% |
A.2 Market Size by Region (2026-2032)
| Регион | 2026 ($M) | 2028 ($M) | 2030 ($M) | 2032 ($M) | CAGR |
|---|---|---|---|---|---|
| Asia-Pacific | 1,080 | 1,390 | 1,740 | 2,210 | 12.8% |
| Europe | 850 | 990 | 1,150 | 1,320 | 7.6% |
| Северная Америка | 620 | 720 | 830 | 920 | 6.8% |
| Middle East & Africa | 180 | 215 | 260 | 310 | 9.5% |
| Latin America | 110 | 150 | 205 | 280 | 16.9% |
| Total | 2,840 | 3,465 | 4,185 | 5,040 | 9.6% |
A.3 Key Market Metrics Summary
| Metric | 2026 | 2032 | Change |
|---|---|---|---|
| Total Market Size | $2.84B | $4.92B | +73% |
| Offshore Wind Share | 31% | 38% | +7 pts |
| Asia-Pacific Share | 38% | 45% | +7 pts |
| Wet-Mate Share | 24% | 30% | +6 pts |
| Top 3 Player Share | 41% | 48% | +7 pts |
| Average Price | $450 | $420 | -7% |
| R&D Intensity | 7.2% | 8.5% | +1.3 pts |
About This Report:
This market analysis was prepared by HYSF Subsea based on industry research, market data, and expert analysis. All figures are estimates based on available information and may vary from actual results.
For More Information:
To discuss market opportunities or request detailed segment analysis, contact our team at info@hysfsubsea.com or visit /market-analysis/.
Related Resources:
– Offshore Wind Solutions
– Oil & Gas Solutions
– Custom Engineering Services
– Свяжитесь с нами


