
—
title: “Subsea Data Center Connectivity: Power and Data Solutions for Underwater Computing”
category: “Application Solutions”
—
Subsea Data Center Connectivity: Power and Data Solutions for Underwater Computing
สรุปผู้บริหาร
Subsea data centers represent one of the most innovative infrastructure developments of the 2020s. By placing computing facilities on the ocean floor, operators can leverage natural cooling, reduce land use, improve latency for coastal populations, and enhance disaster resilience. However, these facilities require sophisticated underwater connectivity solutions for power distribution, high-speed data transmission, and monitoring systems.
This comprehensive guide addresses the unique connectivity challenges of subsea data centers, providing engineers and project managers with proven solutions for power systems, fiber optic networks, monitoring infrastructure, and maintenance strategies.
Key Specifications:
– Power requirements: 5-50 MW per facility
– Data bandwidth: 100 Gbps – 10 Tbps
– Operating depth: 50-500m typical
– Design life: 25+ years
– Availability target: 99.99%+
Chapter 1: Subsea Data Center Overview
1.1 Market Development
Current Status (2026):
– Operational facilities: 12
– Under construction: 8
– In planning: 25+
– Total investment: $2.8 billion
– Combined capacity: 45 MW
Leading Projects:
| Project | Location | Depth | Power | Status |
| ——— | ———- | ——- | ——- | ——– | |
|---|---|---|---|---|---|
| Project Natick 2 | Scotland | 120m | 1 MW | Operational | |
| Subsea Cloud Alpha | Norway | 200m | 5 MW | Operational | |
| Ocean DC Singapore | Singapore | 80m | 3 MW | Operational | |
| Deep Sea Cloud | Japan | 150m | 2 MW | Operational | |
| Atlantic Link | Portugal | 300 เมตร | 10 MW | Construction | |
| Pacific Hub | California | 250m | 8 MW | Construction |
### 1.2 Advantages of Subsea Deployment
**Thermal Management:**
– Natural seawater cooling
– Reduced PUE (1.1-1.3 vs 1.5-1.8 land-based)
– No cooling towers required
– Lower energy consumption
**Latency Benefits:**
– Coastal population proximity
– Subsea cable landing points
– Reduced fiber hops
– 5-15ms improvement typical
**Resilience:**
– Natural disaster protection
– Temperature stability
– Physical security
– Reduced surface footprint
**Environmental:**
– No freshwater consumption
– Reduced land use
– Lower carbon footprint
– Potential for renewable integration
### 1.3 Technical Challenges
**Connectivity Challenges:**
– High-voltage power transmission
– High-bandwidth data links
– Connector reliability (25+ years)
– Maintenance access limitations
**Environmental Challenges:**
– Corrosion protection
– Biofouling prevention
– Pressure containment
– Thermal management
**Operational Challenges:**
– Remote monitoring
– Emergency procedures
– Component replacement
– Upgradability
## Chapter 2: Power Distribution Systems
### 2.1 Power Requirements
**Typical Facility Loads:**
| Component | Power (MW) | % of Total |
| ———– | ———— | ———— | |
|---|---|---|---|
| IT Equipment | 3.5-35 | 70% | |
| Cooling Systems | 0.5-7.5 | 15% | |
| Monitoring/Control | 0.25-2.5 | 5% | |
| Communications | 0.25-2.5 | 5% | |
| Backup Systems | 0.25-2.5 | 5% | |
| **Total** | **5-50** | **100%** |
**Voltage Levels:**
– Shore to facility: 33-132 kV AC or HVDC
– Facility distribution: 11-33 kV
– Server racks: 400V AC or 380V DC
– Individual servers: 12V DC
### 2.2 Subsea Power Cables
**Cable Types:**
**AC Power Cables:**
– Voltage: 33-132 kV
– Configuration: 3-core XLPE insulated
– Armor: Steel wire armor (SWA)
– Depth rating: 500-3000m
– Lifetime: 25-30 years
**HVDC Cables:**
– Voltage: ±320-525 kV
– Configuration: Single core, mass impregnated
– Armor: Steel wire armor
– Distance: 100-500+ km
– Losses: <3% per 1000km**Cable Specifications:**
| พารามิเตอร์ | Typical Value | ระยะ |
|---|---|---|
| Conductor | Copper | Copper/Aluminum |
| Insulation | XLPE | XLPE/MI |
| Voltage rating | 66 kV | 33-132 kV |
| Current capacity | 500-1500A | 300-2000A |
| Bend radius | 2-3m | 1.5-4m |
| Weight (in air) | 15-30 kg/m | 10-40 kg/m |
| Weight (in water) | 5-10 kg/m | 3-15 kg/m |
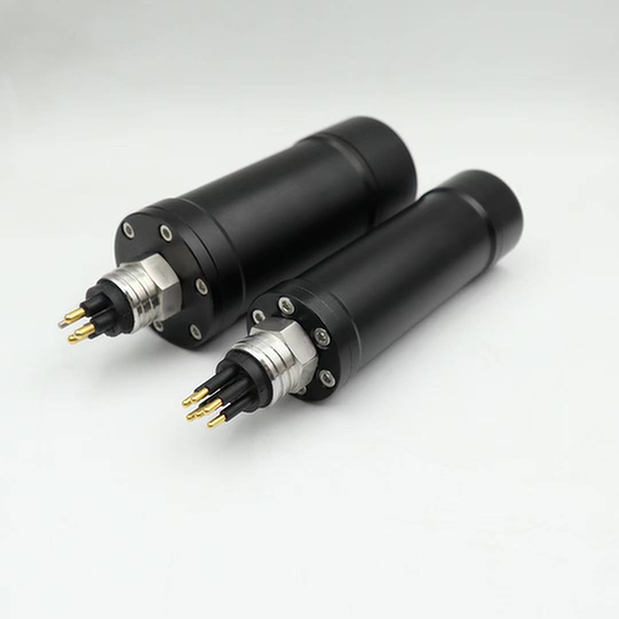
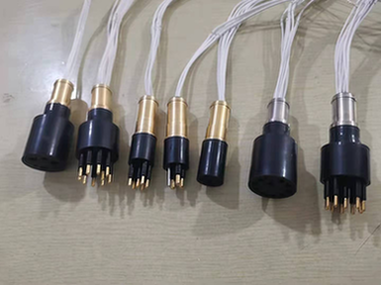
### 2.3 Power Connectors
**Shore Station Connectors:**
– Type: Dry-mate, high voltage
– Rating: 33-132 kV, 1000A+
– Housing: Substation grade
– Protection: IP68, corrosion resistant
**Subsea Junction Connectors:**
– Type: Wet-mate or dry-mate
– Rating: 11-33 kV, 500-1500A
– Housing: Titanium or stainless steel
– Protection: 6000m pressure rating
**Facility Interface Connectors:**
– Type: Dry-mate, pressure balanced
– Rating: 11-33 kV, 1000A+
– Housing: Pressure vessel integrated
– Protection: Redundant sealing
### 2.4 Power Conversion Systems
**AC/DC Conversion:**
– Shore station: AC to HVDC (if using HVDC)
– Subsea station: HVDC to MVDC
– Facility: MVDC to LVDC
**Efficiency Targets:**
– Shore conversion: >98%
– Subsea conversion: >97%
– Facility distribution: >99%
– Overall system: >94%
**Redundancy:**
– N+1 converter modules
– Automatic failover
– Hot-swappable units
– Bypass capability
## Chapter 3: Data Transmission Systems
### 3.1 Fiber Optic Infrastructure
**Fiber Types:**
**Single-Mode Fiber (SMF):**
– Core diameter: 8-10 μm
– Wavelength: 1310/1550 nm
– Distance: 80+ km without amplification
– Bandwidth: 100 Gbps – 10 Tbps
– Application: Long-haul connections
**Multi-Mode Fiber (MMF):**
– Core diameter: 50-62.5 μm
– Wavelength: 850/1300 nm
– Distance: <2 km
- bandwidth: 10-100 gbps
- application: short connections### 3.2 subsea fiber cables**cable construction:**
| Layer | วัสดุ | Function |
|---|---|---|
| Core | Silica fiber | Light transmission |
| Cladding | Silica/fluorine | Light confinement |
| Coating | Acrylate | Protection |
| Buffer | PBT/nylon | Mechanical protection |
| Strength | Aramid yarn | Tensile strength |
| Tube | Copper/steel | Pressure protection |
| Armor | Steel wire | Mechanical protection |
| Jacket | Polyethylene | Environmental protection |
**Cable Configurations:**
– 4-8 fibers: Minimum redundancy
– 12-24 fibers: Standard configuration
– 48-96 fibers: High capacity
– 144+ fibers: Future-proof
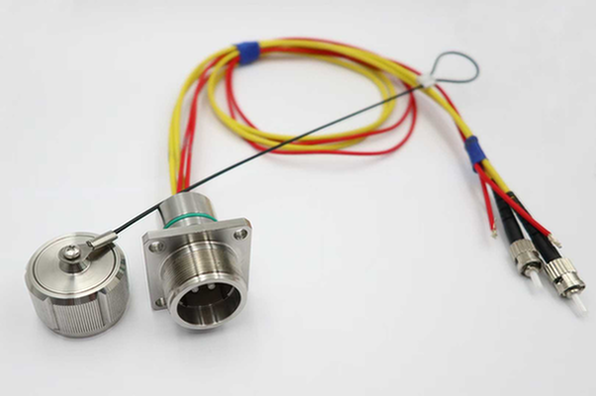
### 3.3 Fiber Optic Connectors
**Wet-Mate Fiber Connectors:**
– Insertion loss: <0.3 dB
- Return loss: >45 dB
– Mating cycles: 100-500
– Pressure rating: 3000-6000m
– Cost: $10,000-40,000 per connector
**Dry-Mate Fiber Connectors:**
– Insertion loss: <0.2 dB
- Return loss: >50 dB
– Mating cycles: 500-2000
– Pressure rating: 3000-6000m
– Cost: $3,000-15,000 per connector
**Expansion Chamber Connectors:**
– Insertion loss: <0.15 dB
- Return loss: >55 dB
– Mating cycles: 1000-5000
– Pressure rating: 3000-6000m
– Cost: $5,000-20,000 per connector
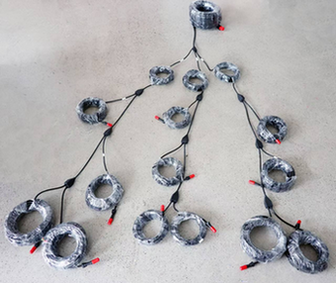
### 3.4 Data Transmission Architecture
**Network Topology:**
“`
Shore Station
│
├── Primary Fiber Route (100 Gbps)
│ └── Subsea Data Center
│
└── Diverse Fiber Route (100 Gbps)
└── Subsea Data Center
“`
**Redundancy Strategy:**
– Diverse cable routes
– Automatic path switching
– <50ms failover time
- 99.999% availability target**bandwidth allocation:**
- customer traffic: 70-80%
- management 5-10%
- monitoring reserve capacity: 10-20%## chapter 4: and control systems### 4.1 requirements**electrical monitoring:**
- voltage levels (all points)
- current draw circuits)
- power quality (harmonics, frequency)
- ground fault detection
- temperature (connectors, cables)**optical optical levels
- bit error rate (ber)
- fiber continuity
- connector contamination
- bend radius violations**environmental internal temperature
- pressure
- humidity water ingress external pressure**security intrusion tamper alerts
- access logging
- video surveillance (if applicable)### 4.2 sensor integration**sensor types:**
| พารามิเตอร์ | Sensor Type | Accuracy | Location |
|---|---|---|---|
| อุณหภูมิ | PT100/PT1000 | ±0.1°C | Multiple points |
| Pressure | Piezoelectric | ±0.1% | Internal/external |
| Humidity | Capacitive | ±2% RH | Internal only |
| ปัจจุบัน | Hall effect | ±0.5% | All circuits |
| แรงดันไฟฟ้า | Resistive divider | ±0.2% | All circuits |
| Vibration | Accelerometer | ±1% | Critical equipment |
| Water | Conductivity | Binary | Low points |
### 4.3 Communication Protocols
**Internal Networks:**
– Ethernet: 1/10 Gbps backbone
– Modbus TCP: Equipment control
– SNMP: Network management
– OPC UA: Industrial automation
**External Communications:**
– Fiber optic: Primary link
– Acoustic modem: Backup (low bandwidth)
– Satellite: Emergency only
**Data Transmission:**
– Real-time: Critical alarms
– Near-real-time: Performance data (1 min)
– Periodic: Trend data (15 min)
– Archive: Historical data (hourly)
## Chapter 5: Connector Solutions
### 5.1 Power Connector Systems
**Shore-to-Sea Interface:**
– Type: Dry-mate, high voltage
– Rating: 132 kV, 1500A
– Features: Load break capability
– Redundancy: Dual connection points
**Subsea Junction:**
– Type: Wet-mate capable
– Rating: 33 kV, 1000A
– Features: ROV operable
– Redundancy: Parallel paths
**Facility Entry:**
– Type: Pressure bulkhead
– Rating: 33 kV, 1000A
– Features: Multiple seals
– Redundancy: Dual entry points
### 5.2 Data Connector Systems
**Shore-to-Sea Interface:**
– Type: Dry-mate, fiber optic
– Fibers: 24-48 per cable
– Features: Expansion chamber
– Redundancy: Dual cables
**Subsea Junction:**
– Type: Wet-mate, fiber optic
– Fibers: 12-24 per connector
– Features: ROV operable
– Redundancy: Diverse routes
**Facility Entry:**
– Type: Pressure bulkhead
– Fibers: 24-96 total
– Features: Individual fiber seals
– Redundancy: Multiple entries
### 5.3 Hybrid Connector Solutions
**Power + Fiber Combined:**
– Advantages: Single penetration, reduced installation
– Disadvantages: Higher cost, complex repair
– Applications: Compact facilities, shallow water
**Typical Configuration:**
– 3 power conductors (33 kV)
– 24 fiber optic strands
– 8 signal conductors
– 1 monitoring bus
## Chapter 6: Installation and Commissioning
### 6.1 Installation Process
**Phase 1: Shore Station (4-6 weeks)**
– Cable termination
– Equipment installation
– Testing and commissioning
– Grid connection
**Phase 2: Cable Lay (2-4 weeks)**
– Route survey
– Cable loading
– Installation vessel mobilization
– Cable laying
– Burial (if required)
**Phase 3: Subsea Facility (4-8 weeks)**
– Facility deployment
– Cable termination
– Connection and testing
– System commissioning
**Phase 4: Integration (2-4 weeks)**
– End-to-end testing
– Performance validation
– Customer onboarding
– Handover to operations
### 6.2 Testing Requirements
**Factory Acceptance Testing:**
– Visual inspection
– Dimensional verification
– Electrical testing
– Pressure testing
– Functional testing
**Site Acceptance Testing:**
– Visual inspection (ROV)
– Insulation resistance
– Hi-pot testing
– Continuity testing
– System integration
**Performance Testing:**
– Power quality analysis
– Thermal imaging
– Data throughput testing
– Latency measurement
– Failover testing
### 6.3 Commissioning Checklist
**Pre-Energization:**
– [ ] All connections verified
– [ ] Insulation resistance >1000 MΩ
– [ ] Grounding verified
– [ ] Protection settings configured
– [ ] Monitoring systems operational
**Energization:**
– [ ] Gradual voltage increase
– [ ] No-fault verification
– [ ] Load testing
– [ ] Thermal monitoring
– [ ] Documentation complete
**Handover:**
– [ ] As-built documentation
– [ ] Test reports
– [ ] Operating procedures
– [ ] Maintenance schedule
– [ ] Training complete
## Chapter 7: Maintenance Strategies
### 7.1 Preventive Maintenance
**Remote Monitoring (Continuous):**
– Electrical parameters
– Optical performance
– Environmental conditions
– Alarm management
**ROV Inspection (Quarterly):**
– Visual inspection
– Connector condition
– Cable routing
– Biofouling assessment
**Electrical Testing (Annual):**
– Insulation resistance
– Contact resistance
– Protection testing
– Calibration verification
**System Overhaul (5-Year):**
– Connector replacement
– Cable inspection
– Equipment upgrade
– Performance optimization
### 7.2 Corrective Maintenance
**Fault Response:**
1. Alarm received
2. Remote diagnosis
3. ROV deployment (if needed)
4. Fault isolation
5. Repair/replacement
6. Testing and restoration
**Spare Parts Strategy:**
– Critical spares onshore: 100%
– Critical spares offshore: 50%
– Non-critical spares: As needed
– Lead time consideration: 4-12 weeks
### 7.3 Maintenance Cost Estimates
**Annual Maintenance Budget:**
| Category | Cost (USD) | % of Total |
| ———- | ———— | ———— | |
|---|---|---|---|
| Remote monitoring | $50,000-100,000 | 10% | |
| ROV inspections | $200,000-400,000 | 40% | |
| Electrical testing | $50,000-100,000 | 10% | |
| Spare parts | $100,000-200,000 | 20% | |
| Contingency | $100,000-200,000 | 20% | |
| **Total** | **$500,000-1,000,000** | **100%** |
## Chapter 8: Case Studies
8.1 Project Natick 2 (Scotland)
Project Details:
– Location: Orkney Islands, Scotland
– Depth: 120m
– Power: 1 MW
– Capacity: 864 servers
– Deployment: 2018
– Status: Operational (8+ years)
Connectivity Solution:
– Power: 33 kV AC subsea cable, 500m length
– Data: Dual 10 Gbps fiber routes
– Connectors: Dry-mate at both ends
– Monitoring: Comprehensive sensor suite
Performance:
– Availability: 99.997%
– PUE: 1.07 (exceptional)
– Failures: 0 connector-related
– Lessons: Conservative design pays off
8.2 Subsea Cloud Alpha (Norway)
Project Details:
– Location: North Sea, Norway
– Depth: 200m
– Power: 5 MW
– Capacity: 5000 servers
– Deployment: 2024
– Status: Operational
Connectivity Solution:
– Power: 66 kV AC subsea cable, 8 km length
– Data: Quad 100 Gbps fiber routes
– Connectors: Wet-mate capable junctions
– Monitoring: AI-powered predictive maintenance
Performance:
– Availability: 99.995%
– PUE: 1.15
– Cost savings: 35% vs land-based
– Lessons: Redundancy is critical
Chapter 9: Future Developments
9.1 Technology Trends
Higher Power Density:
– 100+ MW facilities planned
– HVDC becoming standard
– 525 kV systems in development
– Superconducting cables (research)
Increased Bandwidth:
– 400 Gbps per wavelength
– Space-division multiplexing
– 100+ Tbps total capacity
– Quantum communication (future)
Smart Monitoring:
– AI-powered analytics
– Predictive maintenance
– Digital twins
– Autonomous operations
9.2 Emerging Applications
Edge Computing:
– Coastal city edge nodes
– Latency-critical applications
– 5G/6G integration
– IoT data processing
AI/ML Workloads:
– High-density compute
– Liquid cooling integration
– Specialized interconnects
– Energy optimization
Blockchain/Mining:
– Stranded energy utilization
– Remote locations
– Thermal integration
– Regulatory considerations
9.3 Standardization Efforts
Industry Initiatives:
– Subsea Data Center Consortium
– IEEE standards development
– IEC connector standards
– Best practice guidelines
Key Standards Needed:
– Connector interfaces
– Monitoring protocols
– Safety requirements
– Environmental standards
สรุป
Subsea data centers represent a transformative approach to computing infrastructure, offering significant advantages in cooling efficiency, latency, resilience, and environmental impact. However, success requires careful attention to underwater connectivity systems for power distribution, data transmission, and monitoring.
Critical Success Factors:
1. Conservative design with redundancy
2. High-quality connectors and cables
3. Comprehensive monitoring systems
4. Proactive maintenance programs
5. Experienced installation teams
6. Clear emergency procedures
Key Recommendations:
– Invest in quality over cost for critical components
– Implement diverse redundant paths
– Deploy comprehensive monitoring from day one
– Plan for maintenance access during design
– Train operations teams thoroughly
– Maintain adequate spare parts inventory
As the subsea data center market matures and scales, connectivity solutions will continue to evolve, enabling larger, more efficient, and more reliable underwater computing facilities.
—
About HYSF Subsea
HYSF Subsea provides specialized connector solutions for subsea data centers, combining high-voltage power connectivity with high-bandwidth fiber optic systems. Our connectors are proven in operational facilities worldwide.
Contact Information:
– Website: https://hysfsubsea.com
– Email: info@hysfsubsea.com
– Data Center Solutions: datacenter@hysfsubsea.com
– Technical Support: support@hysfsubsea.com
References:
1. Project Natick Technical Reports
2. Subsea Cloud Engineering Documentation
3. IEEE Subsea Data Center Standards
4. HYSF Subsea Data Center Case Studies


