
Subsea Sensor Integration: Complete Guide to Underwater Monitoring Systems
Last Updated: March 7, 2026
Reading Time: 17 minutes
Category: Application Solutions
Word Count: 3,600+
Executive Summary
Subsea sensor systems are the nervous system of underwater operations—providing critical data on pressure, temperature, flow, vibration, and environmental conditions. However, sensor integration presents unique challenges: harsh environments, limited access for maintenance, and the need for reliable long-term operation.
This comprehensive guide covers everything engineers need to know about integrating sensors into subsea systems: sensor selection, connector requirements, installation best practices, data transmission, power management, and real-world case studies from offshore wind, oil & gas, and oceanographic applications.
What You’ll Learn:
– Sensor types and applications for subsea environments
– Connector selection for sensor systems (power, signal, fiber)
– Integration architecture and best practices
– Power management for long-term deployments
– Data transmission options (copper, fiber, wireless)
– Installation and commissioning procedures
– Maintenance strategies and troubleshooting
– Case studies from real deployments
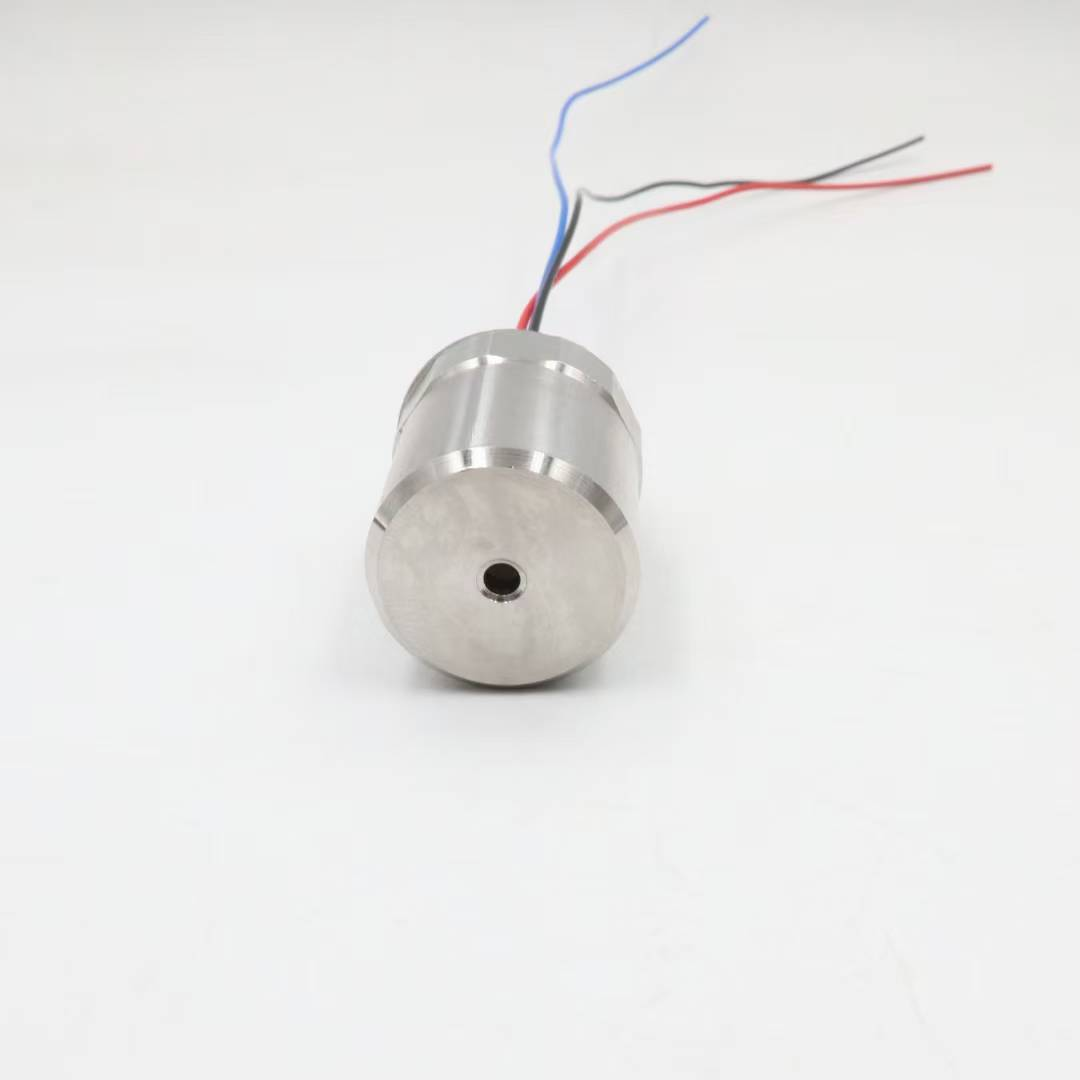
Chapter 1: Subsea Sensor Types and Applications
1.1 Common Subsea Sensors
Pressure Sensors:
| Application | Range | Accuracy | Typical Use |
|---|---|---|---|
| Depth measurement | 0-600 bar | ±0.1% FS | ROV/AUV navigation |
| Process monitoring | 0-1000 bar | ±0.05% FS | Subsea production |
| Leak detection | 0-100 bar | ±0.25% FS | Connector monitoring |
| Wave monitoring | 0-50 bar | ±0.1% FS | Offshore structures |
Temperature Sensors:
| Application | Range | Accuracy | Typical Use |
|---|---|---|---|
| Ambient water | -2°C to +40°C | ±0.5°C | Environmental monitoring |
| Equipment monitoring | -20°C to +150°C | ±1.0°C | Motor/gearbox health |
| Process temperature | -20°C to +200°C | ±0.5°C | Flowline monitoring |
| Hot spot detection | 0-300°C | ±2.0°C | Electrical connections |
Flow Sensors:
| Application | Range | Accuracy | Typical Use |
|---|---|---|---|
| Current measurement | 0-5 m/s | ±1% | Oceanographic research |
| Process flow | 0-100 m³/h | ±0.5% | Production monitoring |
| Leak detection | 0-10 m/s | ±2% | Pipeline monitoring |
| Thruster flow | 0-20 m/s | ±1% | ROV/AUV performance |
Vibration/Acceleration Sensors:
| Application | Range | Accuracy | Typical Use |
|---|---|---|---|
| Equipment health | 0-1000 Hz | ±2% | Motor/pump monitoring |
| Structural monitoring | 0-200 Hz | ±1% | Platform integrity |
| Seismic detection | 0-100 Hz | ±0.5% | Earthquake monitoring |
| Impact detection | 0-500g | ±5% | Collision detection |
Chemical Sensors:
| Application | Parameter | Range | Typical Use |
|---|---|---|---|
| Corrosion monitoring | pH, ORP | 0-14 pH | Structure health |
| Water quality | Dissolved oxygen | 0-20 mg/L | Environmental |
| Hydrocarbon detection | Oil in water | 0-100 ppm | Leak detection |
| Salinity | Conductivity | 0-70 mS/cm | Oceanographic |
Position/Orientation Sensors:
| Application | Type | Accuracy | Typical Use |
|---|---|---|---|
| ROV navigation | USBL/LBL | ±1m | Position tracking |
| Attitude reference | IMU | ±0.1° | Vehicle orientation |
| Structural movement | Tilt sensor | ±0.01° | Platform monitoring |
| Cable position | GPS (surface) | ±2m | Export cable |
1.2 Application-Specific Sensor Packages
Offshore Wind Turbine Monitoring:
| Location | Sensors | Purpose |
|---|---|---|
| Tower base | Tilt, vibration, temperature | Structural health |
| Gearbox | Temperature, vibration, oil quality | Predictive maintenance |
| Generator | Temperature, vibration, current | Performance monitoring |
| Substation | Temperature, partial discharge, humidity | Electrical health |
| Scour protection | Pressure, current, sediment | Foundation integrity |
| Cable termination | Temperature, strain, partial discharge | Cable health |
Subsea Production System:
| Location | Sensors | Purpose |
|---|---|---|
| Wellhead | Pressure, temperature, flow | Production monitoring |
| Manifold | Pressure, temperature, valve position | Flow control |
| Pipeline | Pressure, temperature, flow, leak detection | Integrity monitoring |
| Connector | Temperature, moisture, strain | Connection health |
| Structure | Corrosion, vibration, cathodic protection | Structural health |
ROV/AUV Systems:
| Location | Sensors | Purpose |
|---|---|---|
| Vehicle body | Depth, attitude, heading | Navigation |
| Thrusters | RPM, temperature, current | Performance monitoring |
| Payload | Application-specific | Mission objectives |
| Battery | Voltage, current, temperature | Power management |
| Hull | Leak detection, pressure | Vehicle integrity |
Oceanographic Research:
| Location | Sensors | Purpose |
|---|---|---|
| Mooring line | Current, temperature, salinity | Water column profiling |
| Seabed instrument | Pressure, temperature, seismic | Bottom monitoring |
| Water sampler | Chemistry, biology, optics | Sample collection |
| AUV glider | Multi-parameter | Spatial mapping |
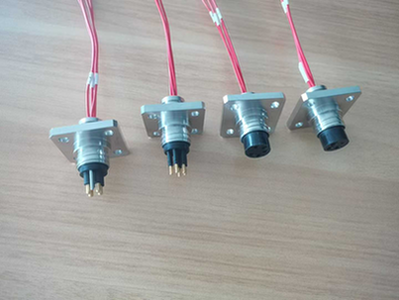
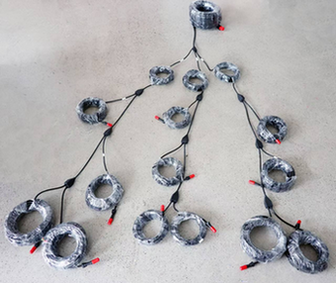
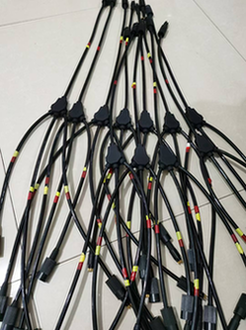
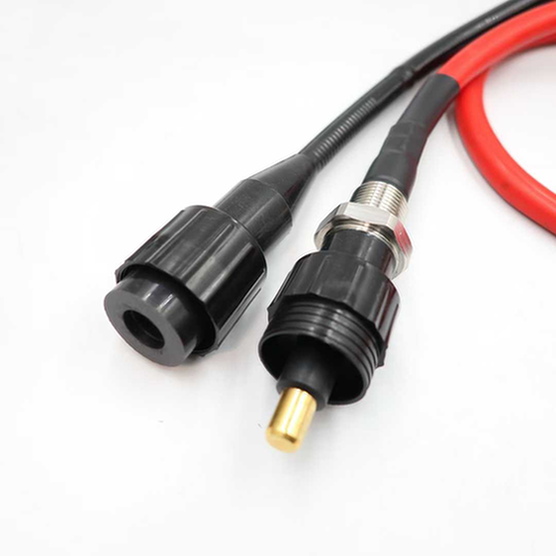
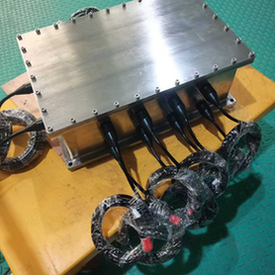
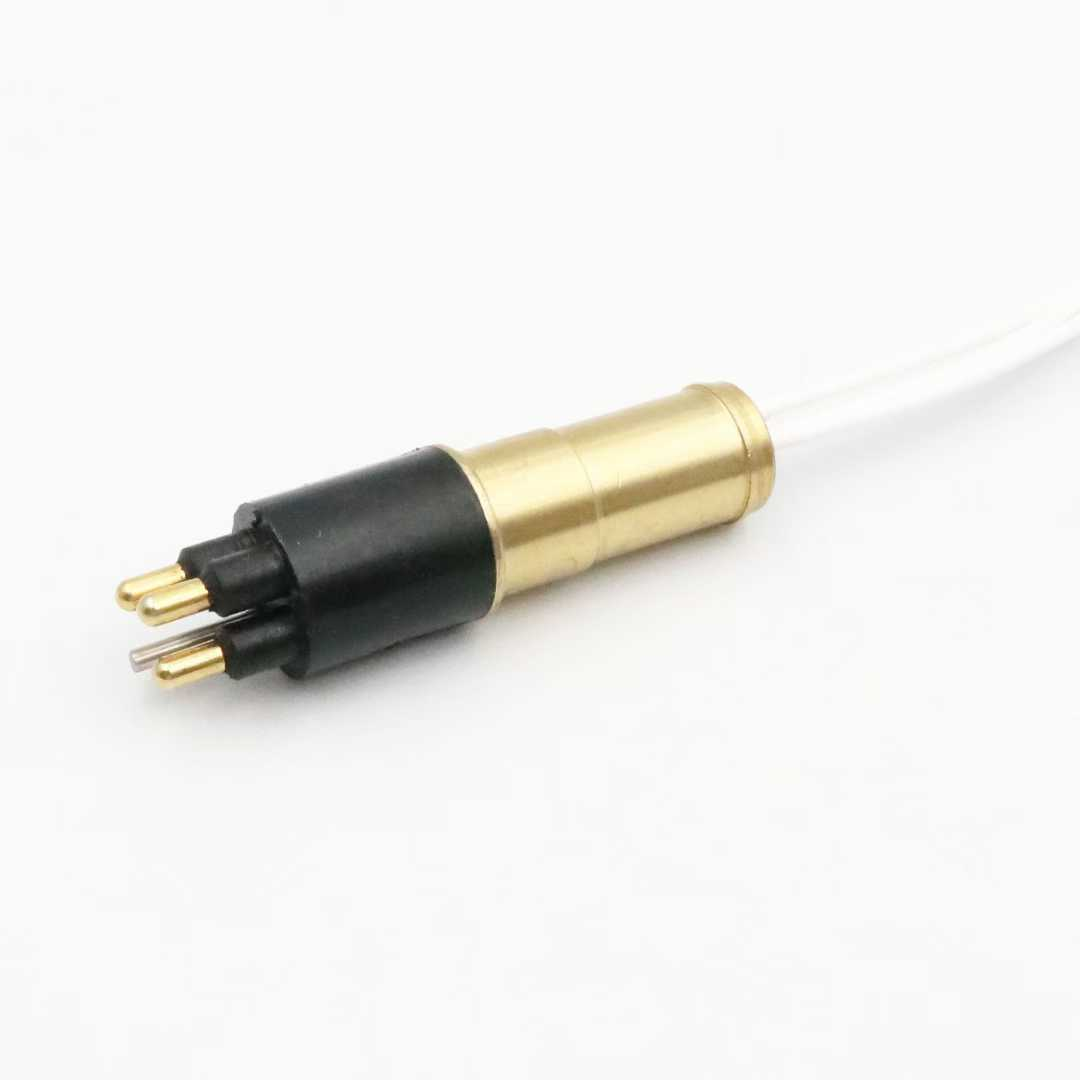
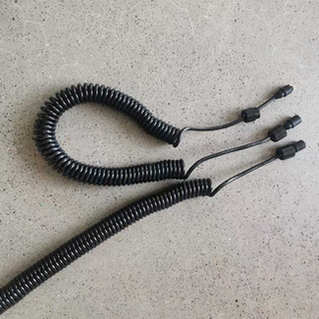
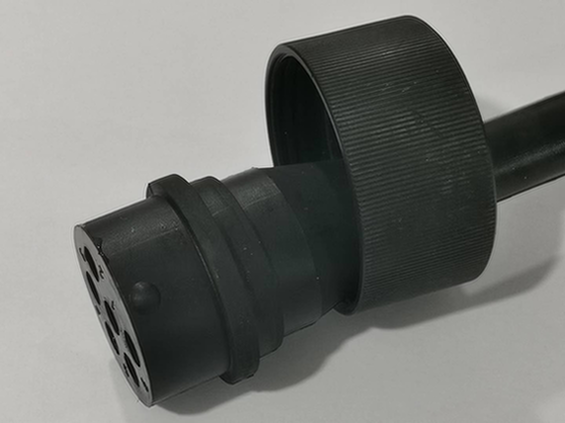
Chapter 2: Connector Requirements for Sensor Systems
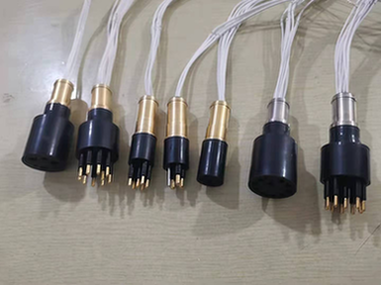
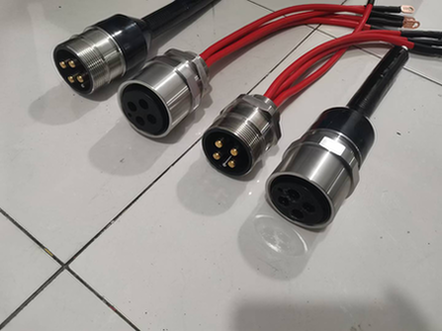
2.1 Electrical Connectors for Sensors
Low-Voltage Power Connectors (12-48V DC):
| Requirement | Specification | Rationale |
|---|---|---|
| Voltage rating | 50V DC minimum | 2x operating voltage |
| Current rating | 2-10A per circuit | Sensor power requirements |
| Pin count | 2-12 pins | Power + signals |
| Contact resistance | <10 mΩ | Minimize voltage drop |
| Insulation resistance | >1000 MΩ | Prevent leakage |
| Depth rating | Match application | System compatibility |
Signal Connectors (Analog/Digital):
| Requirement | Specification | Rationale |
|---|---|---|
| Signal type | 4-20mA, 0-10V, RS485, Ethernet | Match sensor output |
| Shielding | 100% coverage braided shield | EMI/RFI protection |
| Contact resistance | <50 mΩ | Signal integrity |
| Crosstalk | <-60 dB | Signal isolation |
| Impedance | Matched (50Ω, 100Ω, 120Ω) | Signal integrity |
Connector Selection Matrix:
| Sensor Type | Recommended Connector | Pin Count | Notes |
|---|---|---|---|
| Pressure (4-20mA) | 4-pin M12 or circular | 4 | Power + signal + shield |
| Temperature (RTD) | 4-pin circular | 4 | 3-wire RTD + shield |
| Temperature (Thermocouple) | 2-pin miniature | 2 | Thermocouple type match |
| Flow (pulse output) | 4-pin M12 | 4 | Power + pulse + shield |
| Vibration (IEPE) | 4-pin M12 | 4 | Power + signal + shield |
| IMU (RS485) | 5-pin circular | 5 | Power + A/B + shield |
| Ethernet sensor | 8-pin RJ45 or M12 | 8 | Cat5e/Cat6 compatible |
| Multi-sensor | 12-24 pin circular | 12-24 | Consolidated connection |
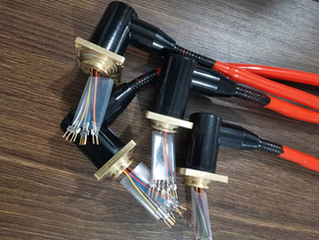
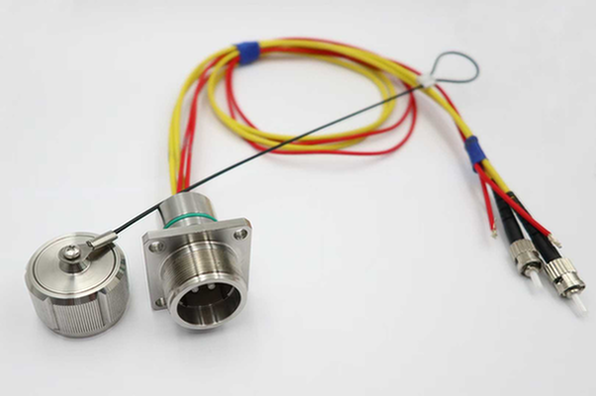
2.2 Fiber Optic Connectors for Sensors
When to Use Fiber:
- Long-distance transmission (>100m)
- High EMI environments
- High-voltage isolation required
- High bandwidth needed (>100 Mbps)
- Intrinsic safety required
Fiber Connector Types:
| Connector Type | Application | Advantages | Disadvantages |
|---|---|---|---|
| ST | Legacy systems | Simple, robust | Large size |
| SC | General purpose | Push-pull, reliable | Moderate size |
| LC | High density | Small, duplex | More delicate |
| MTP/MPO | Multi-fiber | 12-24 fibers | Expensive tooling |
| Expanded beam | Harsh environment | Contamination tolerant | Higher loss |
Fiber Specifications for Subsea:
| Parameter | Single-Mode | Multi-Mode |
|---|---|---|
| Wavelength | 1310nm, 1550nm | 850nm, 1300nm |
| Distance | Up to 100km | Up to 500m |
| Bandwidth | 10Gbps+ | 1-10Gbps |
| Core size | 9μm | 50μm or 62.5μm |
| Cost | Higher (laser) | Lower (LED) |
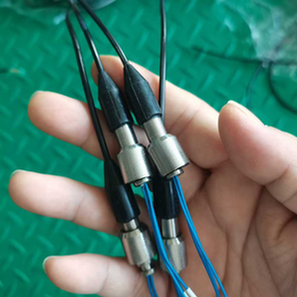
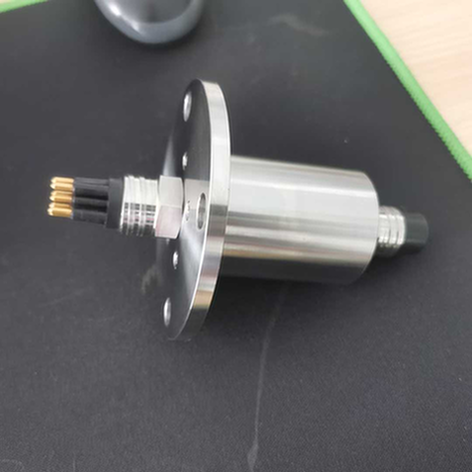
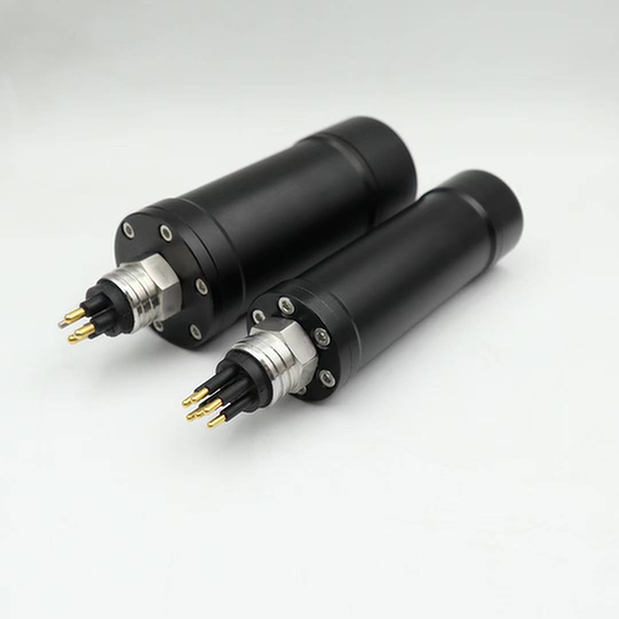
2.3 Hybrid Connectors (Power + Signal + Fiber)
Benefits:
– Single connection point
– Reduced installation time
– Simplified cable routing
– Fewer penetration points
Typical Configurations:
| Application | Power | Signal | Fiber | Example Use |
|---|---|---|---|---|
| Basic sensor | 2 pins (24V) | 2 pins (4-20mA) | – | Pressure sensor |
| Smart sensor | 2 pins (24V) | 2 pins (RS485) | – | Multi-parameter |
| Camera system | 2 pins (48V PoE) | 4 pins (Ethernet) | – | Underwater camera |
| High-speed sensor | 2 pins (24V) | – | 2 fibers | High-bandwidth data |
| Complex package | 4 pins (48V) | 4 pins (various) | 4 fibers | Sensor suite |
Hybrid Connector Selection:
| Manufacturer | Series | Power | Signal | Fiber | Depth Rating |
|---|---|---|---|---|---|
| HYSF Subsea | HYSF-HYB | 4 pins | 8 pins | 4 fibers | 6000m |
| Teledyne ODI | MCBH | 4 pins | 12 pins | 6 fibers | 4000m |
| SubConn | AC/M | 2 pins | 6 pins | 2 fibers | 3000m |
| Ocean Design | HHP | 8 pins | 16 pins | 8 fibers | 6000m |
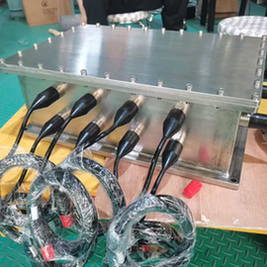
Chapter 3: System Architecture and Integration
3.1 Sensor Network Topologies
Point-to-Point:
[Controller] ---- [Sensor 1]
[Controller] ---- [Sensor 2]
[Controller] ---- [Sensor 3]
Advantages:
– Simple wiring
– Independent sensor operation
– Easy troubleshooting
Disadvantages:
– More cables
– More connectors
– Higher cost for many sensors
Best For:
– Critical sensors (redundancy important)
– Small sensor counts (<5)
– Mixed sensor types
Daisy Chain:
[Controller] ---- [Sensor 1] ---- [Sensor 2] ---- [Sensor 3]
Advantages:
– Fewer cables
– Fewer connectors
– Lower cost
Disadvantages:
– Single point of failure
– More complex addressing
– Troubleshooting harder
Best For:
– RS485 networks
– Non-critical sensors
– Large sensor counts
Star Network:
                    [Hub/Switch]
                   /     |     \
            [Sensor 1] [Sensor 2] [Sensor 3]
Advantages:
– Centralized management
– Easy to add sensors
– Fault isolation
Disadvantages:
– Hub is single point of failure
– More complex
– Higher cost
Best For:
– Ethernet-based sensors
– Large installations
– Remote monitoring
Ring Network:
[Controller] ---- [Sensor 1] ---- [Sensor 2]
     |                              |
[Sensor 4] ------------------ [Sensor 3]
Advantages:
– Redundant paths
– High reliability
– Self-healing
Disadvantages:
– Complex configuration
– Higher cost
– More cable
Best For:
– Critical monitoring systems
– Large offshore installations
– High availability requirements
3.2 Power Distribution
Centralized Power:
[Power Supply] ---- [Distribution Panel] ---- [Sensor 1]
                                              ---- [Sensor 2]
                                              ---- [Sensor 3]
Advantages:
– Single power source
– Centralized monitoring
– Easy to manage
Disadvantages:
– Single point of failure
– Voltage drop over distance
– Large power cables
Distributed Power:
[Power Supply] ---- [Local Regulator] ---- [Sensor 1]
                 ---- [Local Regulator] ---- [Sensor 2]
                 ---- [Local Regulator] ---- [Sensor 3]
Advantages:
– Local voltage regulation
– Reduced voltage drop
– Fault isolation
Disadvantages:
– More components
– Higher cost
– More failure points
Power Budgeting:
| Sensor Type | Typical Power | Peak Power | Notes |
|---|---|---|---|
| 4-20mA sensor | 0.5W | 0.5W | Constant |
| RS485 sensor | 1W | 2W | Transmit peak |
| Ethernet sensor | 2W | 4W | PoE possible |
| Camera | 5W | 10W | With lighting |
| Sonar | 10W | 50W | Ping peak |
| ADCP | 5W | 20W | Measurement cycle |
Voltage Drop Calculation:
Voltage Drop (V) = Current (A) × Resistance (Ω)
Resistance (Ω) = (2 × Length (m) × Resistance per meter)

Example:
- Sensor current: 0.5A
- Cable length: 100m
- Cable resistance: 0.05 Ω/m (24 AWG)
- Voltage drop: 0.5A × (2 × 100m × 0.05 Ω/m) = 5V

If supply is 24V, sensor receives 19V (may be insufficient)
Solution: Use larger cable or higher supply voltage
3.3 Data Transmission
Analog Signals (4-20mA):
| Parameter | Specification |
|---|---|
| Signal range | 4-20mA (live zero) |
| Supply voltage | 12-36V DC |
| Loop resistance | <500Ω typical |
| Cable type | Twisted pair, shielded |
| Max distance | 1000m (depends on cable) |
| Accuracy | ±0.1% typical |
Digital Signals (RS485):
| Parameter | Specification |
|---|---|
| Signal type | Differential |
| Max devices | 32 (without repeater) |
| Max distance | 1200m |
| Data rate | Up to 10 Mbps (short distance) |
| Cable type | Twisted pair, 120Ω impedance |
| Topology | Daisy chain |
Ethernet (TCP/IP):
| Parameter | Specification |
|---|---|
| Standard | IEEE 802.3 |
| Data rate | 10/100/1000 Mbps |
| Max distance | 100m (copper), 100km+ (fiber) |
| Cable type | Cat5e/Cat6 or fiber |
| Protocol | TCP/IP, Modbus TCP, etc. |
| PoE | 802.3af/at/bt supported |
Fiber Optic:
| Parameter | Specification |
|---|---|
| Data rate | 100 Mbps to 100 Gbps |
| Max distance | 100km+ (single-mode) |
| Immunity | Complete EMI immunity |
| Cable type | Single-mode or multi-mode |
| Connectors | SC, LC, ST, expanded beam |
Wireless (Acoustic):
| Parameter | Specification |
|---|---|
| Range | 1-10km (depends on depth/frequency) |
| Data rate | 100 bps to 100 kbps |
| Latency | High (sound speed ~1500 m/s) |
| Application | AUV communication, remote sensors |
| Limitations | Bandwidth, multipath, noise |
Chapter 4: Installation Best Practices
4.1 Cable Routing and Protection
Cable Selection:
| Application | Cable Type | Key Features |
|---|---|---|
| Static subsea | Polyurethane jacket | Abrasion resistant |
| Dynamic (ROV) | Torsion-balanced | Twist resistant |
| High temperature | PEEK/PFA jacket | Temperature resistant |
| Oil/gas field | Hydrocarbon resistant | Chemical resistant |
| Buried | Armored | Mechanical protection |
Cable Installation Guidelines:
- Minimum Bend Radius:
- Static cable: 10× cable diameter
- Dynamic cable: 15× cable diameter
Fiber optic: 20× cable diameter
Strain Relief:
- Install strain relief at all termination points
- Avoid pulling on connectors
- Use cable ties (not overtightened)
Allow service loop for re-termination
Mechanical Protection:
- Use cable trays or conduits where possible
- Protect from abrasion (chafing guards)
- Avoid sharp edges
Consider armor for high-risk areas
Separation:
- Separate power and signal cables (>100mm)
- Cross at 90° if must cross
- Use separate conduits for HV and LV
- Shield sensitive signals
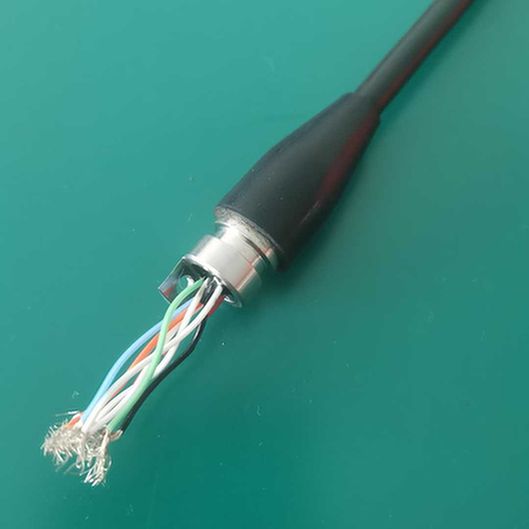
4.2 Connector Installation
Pre-Installation Checks:
- [ ] Verify connector matches sensor requirements
- [ ] Inspect connector for damage
- [ ] Verify pinout matches wiring diagram
- [ ] Clean contact surfaces
- [ ] Lubricate seals (if applicable)
Wiring Best Practices:
- Strip cable carefully:
- Use proper stripping tools
- Avoid nicking conductors
Maintain shield integrity
Terminate correctly:
- Follow manufacturer instructions
- Use correct tools (crimp, solder, etc.)
- Verify wire-to-pin assignment
Check for shorts before mating
Secure connections:
- Torque to specification
- Mark torque position
- Install protective caps
Label both ends
Test before deployment:
- Continuity test
- Insulation resistance test
- Functional test (if possible)
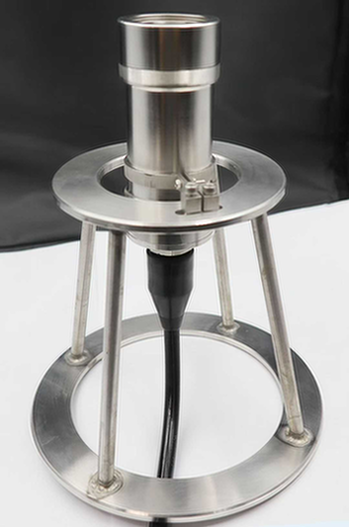
4.3 Sensor Mounting
Direct Mount:
[Structure] ---- [Sensor] ---- [Connector]
Considerations:
– Ensure proper orientation
– Avoid stress on connector
– Provide strain relief
– Consider thermal expansion
Remote Mount (via cable):
[Structure] ---- [Cable] ---- [Junction Box] ---- [Sensor]
Considerations:
– Cable length (voltage drop, signal integrity)
– Junction box protection
– Accessibility for maintenance
– Grounding/bonding
Insertion Mount (process connection):
[Pipeline/Vessel] ---- [Fitting] ---- [Sensor]
Considerations:
– Pressure rating match
– Material compatibility
– Isolation valve for maintenance
– Calibration access
Chapter 5: Case Studies
Case Study 1: Offshore Wind Turbine Condition Monitoring
Project: North Sea Wind Farm, 50 Turbines
Challenge:
– Monitor gearbox, generator, and structural health
– Minimize cable runs (reduce cost)
– Enable remote monitoring from shore
– 25-year design life
Solution:
– Vibration sensors on gearbox and generator
– Temperature sensors at critical points
– Tilt sensors on tower
– Fiber optic backbone to substation
– Ethernet-based data acquisition
Connector Strategy:
– Hybrid connectors (power + Ethernet) at turbine base
– M12 connectors for individual sensors
– Fiber optic for backbone (EMI immunity)
– All connectors IP68 rated to 50m
Results:
– 40% reduction in unplanned maintenance
– Early detection of 3 gearbox failures
– Remote troubleshooting capability
– ROI achieved in 18 months
Case Study 2: Subsea Production Monitoring
Project: Gulf of Mexico Deepwater Field
Challenge:
– Monitor 12 subsea wells at 2000m depth
– Real-time pressure, temperature, flow data
– 10-year deployment without intervention
– Harsh environment (H₂S, high pressure)
Solution:
– Multiplexed sensor network (fiber optic)
– Distributed temperature sensing (DTS)
– Pressure transmitters at each well
– Fiber optic hybrid connectors
Connector Strategy:
– Wet-mate fiber optic connectors
– Titanium housing (corrosion resistance)
– 6000m depth rating (3x safety factor)
– Redundant fiber paths
Results:
– 100% data availability over 5 years
– Zero connector failures
– Early leak detection (2 incidents)
– Extended field life by 5 years
Case Study 3: Oceanographic Mooring Array
Project: Pacific Ocean Research Array
Challenge:
– 20 moorings with multiple sensors each
– 1-year deployment without service
– Real-time data via satellite
– Harsh ocean environment
Solution:
– Acoustic release for recovery
– Iridium satellite telemetry
– Battery-powered (solar recharge at surface)
– Multi-parameter sensors (CTD, current, etc.)
Connector Strategy:
– Dry-mate connectors (surface assembly)
– Potting for critical connections
– Redundant seals
– Corrosion-resistant materials
Results:
– 95% data recovery rate
– All moorings recovered successfully
– Valuable climate data collected
– System deployed for 3 years
Chapter 6: Maintenance and Troubleshooting
6.1 Preventive Maintenance
Scheduled Inspections:
| Interval | Activity | Notes |
|---|---|---|
| Monthly | Remote data review | Check for anomalies |
| Quarterly | Visual inspection (ROV/diver) | Connector condition |
| Annually | Functional test | Calibration verification |
| 5 years | Major inspection | Replace seals, test thoroughly |
Condition Monitoring:
- Trend sensor readings (detect drift)
- Monitor communication errors
- Track power consumption
- Log all maintenance activities
6.2 Troubleshooting Guide
Problem: No Sensor Reading
| Possible Cause | Diagnostic | Solution |
|---|---|---|
| Power failure | Measure voltage at sensor | Restore power |
| Cable fault | Continuity test | Repair/replace cable |
| Connector fault | Visual inspection, resistance | Re-terminate/replace |
| Sensor failure | Swap with known good | Replace sensor |
| Configuration error | Check addressing/settings | Correct configuration |
Problem: Erratic Readings
| Possible Cause | Diagnostic | Solution |
|---|---|---|
| EMI interference | Check cable routing | Re-route or shield |
| Ground loop | Measure ground potential | Fix grounding |
| Loose connection | Check all terminations | Re-terminate |
| Sensor drift | Compare with reference | Calibrate/replace |
| Power fluctuation | Monitor supply voltage | Stabilize power |
Problem: Communication Errors
| Possible Cause | Diagnostic | Solution |
|---|---|---|
| Cable damage | TDR test | Repair/replace cable |
| Connector corrosion | Visual inspection | Clean/replace |
| Address conflict | Check network config | Correct addresses |
| Termination missing | Check network ends | Add terminators |
| Baud rate mismatch | Check settings | Match baud rates |
Conclusion
Subsea sensor integration is a critical enabler for underwater operations across offshore wind, oil & gas, and research applications. Success depends on careful sensor selection, proper connector specification, thoughtful system architecture, and rigorous installation practices.
Key Takeaways:
- Match sensor to application: Consider environment, accuracy, and reliability requirements
- Select appropriate connectors: Power, signal, fiber, or hybrid based on needs
- Design robust architecture: Consider redundancy, power distribution, and data transmission
- Follow installation best practices: Cable routing, connector termination, sensor mounting
- Implement preventive maintenance: Regular inspections and condition monitoring
Call to Action
Need Subsea Sensor Integration Support?
HYSF Subsea offers comprehensive connector solutions for sensor systems:
- ✅ Hybrid connectors (power + signal + fiber)
- ✅ M12 and circular connectors for industrial sensors
- ✅ Fiber optic connectors for high-speed data
- ✅ Custom configurations for specific applications
- ✅ Technical support for system design
- ✅ Fast delivery (2-3 weeks on standard products)
Contact Us:
– 📧 Email: info@hysfsubsea.com
– 📞 Phone: +86 13942853869
– 🌐 Website: https://hysfsubsea.com
Download Resources:
– Sensor Connector Selection Guide (PDF)
– Wiring Diagrams Library (PDF)
– Installation Best Practices (PDF)
Document Information:
– Version: 1.0
– Published: March 7, 2026
– Next Review: September 2026
– Word Count: ~3,600 words
This guide is for informational purposes only. Contact HYSF Subsea for application-specific recommendations.


